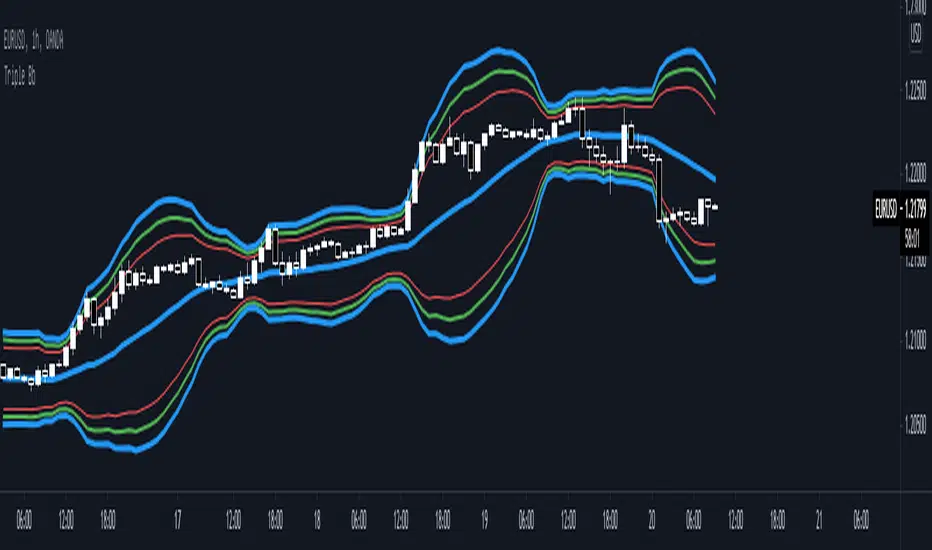
Triple Bb* Triple Bb display maximum 3 Bollinger Bands and each bands could be easily adjust.
* Each Bands Adjustable:
1. Source
2. Period
3. Standard Deviation
4. Color
5. Width
6. Show / Not Show
볼린저 밴드 (BB)
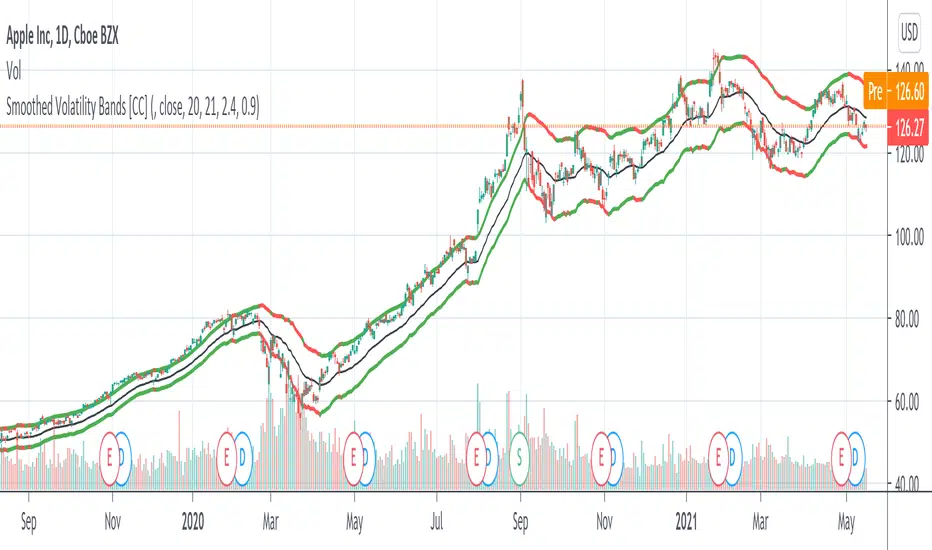
Smoothed Volatility Bands [CC]The Smoothed Volatility Bands were created by Sylvain Vervoort (Stocks and Commodities Sep 2020 pg 19) and this is a heavily customized version of regular Bollinger Bands that take volatility into account. Feel free to change the moving average since Vervoort recommended trying that out. Buy when the indicator line turns green and sell when it turns red.
Let me know if there are any other indicators you want me to publish!
Value RangeHere is another attempt to chase value based on technical analysis.
This is extended version of PE range script published earlier.
Instead of just PE, this script contains several other factors which defines value. You can chose which factor to look at from input dialog:
Possible value factors included in this script are:
Price to Earnings
Price to Sales
Price to Book
PE - Forwarding
PS - Forwarding
Price to Cashflow
Enterprise Value to EBITDA
Enterprise Value to Cashflow
Some of these can be added to chart directly from financials. But, the script also calculate range based on donchian channel or bollinger bands. Instead of short periods, we are looking for periods in terms of years. Rest of things remain same.

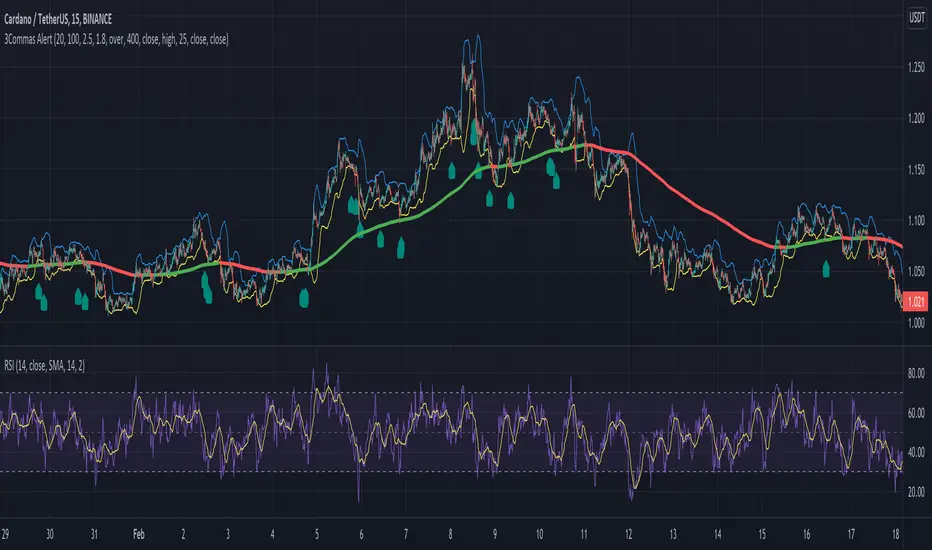
Alert for 3Commas Bollinger StrategyThis is just an alert for the 3Commas Bollinger Strategy written by tedwardd
Rate Of Change Bands [CC]The Rate Of Change Bands were created by Vitali Apirine (Stocks and Commodities March 2021 pg 14) and this indicator is a great method to not only check the momentum but also check the trend strength as well. I have color coded the lines so buy when the line turns green and sell when it turns red.
Let me know if there are any other indicators you want me to publish!

Multiple Timeframe Fib Bollinger Bands - can be used for 3commas*** This idea is based on Bollingers Bands Fibonacci ratios by Shizaru ()
** This will look less chaotic if you don't have all four time frames on at once! I left them on for the demo picture just to show them all simultaneously working.
This is the basis for most of my bot ideas - indicators from longer chart time frames laid over short time frame charts. What I mean by this is that I like the responsiveness of a 1m chart but indicators from a 1h or 4h chart. There are obviously downsides to doing this or everyone would do it, but I have consistently gotten top results using this method. This is a study, so not a strategy yet but you can use this with 3commas if you convert it to a strategy using band crossover/under points as buy and sell triggers.
That is super easy; just follow this excellent guide here which should work for this script:
kodify.net
It's not super hard if you know a little Pine but if you need help hit me up and we can figure something out.
This script by default has 15m, 30m, 1h and 4h settings that are configurable via the gear icon. You can enable or disable any time frame, change the color, etc. I will probably add accurate line labels, custom time frames and adjustable transparency soon.
It's advisable to use higher time frame indicator on a lower time frame chart, but not the other way around. I would use these indicators on a 1m chart but not a 1d chart, for example.
Have fun and I hope you get some use out of this! I use it for context more than bots but it is definitely possible to use it with both.

Bollinger Band Width PercentileIntroducing the Bollinger Band Width Percentile
Definitions :
Bollinger Band Width Percentile is derived from the Bollinger Band Width indicator.
It shows the percentage of bars over a specified lookback period that the Bollinger Band Width was less than the current Bollinger Band Width.
Bollinger Band Width is derived from the Bollinger Bands® indicator.
It quantitatively measures the width between the Upper and Lower Bands of the Bollinger Bands.
Bollinger Bands® is a volatility-based indicator.
It consists of three lines which are plotted in relation to a security's price.
The Middle Line is typically a Simple Moving Average.
The Upper and Lower Bands are typically 2 standard deviations above, and below the SMA (Middle Line).
Volatility is a statistical measure of the dispersion of returns for a given security or market index, measured by the standard deviation of logarithmic returns.
The Broad Concept :
Quoting Tradingview specifically for commonly noted limitations of the BBW indicator which I have based this indicator on....
“ Bollinger Bands Width (BBW) outputs a Percentage Difference between the Upper Band and the Lower Band.
This value is used to define the narrowness of the bands.
What needs to be understood however is that a trader cannot simply look at the BBW value and determine if the Band is truly narrow or not.
The significance of an instruments relative narrowness changes depending on the instrument or security in question.
What is considered narrow for one security may not be for another.
What is considered narrow for one security may even change within the scope of the same security depending on the timeframe.
In order to accurately gauge the significance of a narrowing of the bands, a technical analyst will need to research past BBW fluctuations and price performance to increase trading accuracy. ”
Here I present the Bollinger Band Width Percentile as a refinement of the BBW to somewhat overcome the limitations cited above.
Much of the work researching past BBW fluctuations, and making relative comparisons is done naturally by calculating the Bollinger Band Width Percentile.
This calculation also means that it can be read in a similar fashion across assets, greatly simplifying the interpretation of it.
Plotted Components of the Bollinger Band Width Percentile indicator :
Scale High
Mid Line
Scale Low
BBWP plot
Moving Average 1
Moving Average 2
Extreme High Alert
Extreme Low Alert
Bollinger Band Width Percentile Properties:
BBWP Length
The time period to be used in calculating the Moving average which creates the Basis for the BBW component of the BBWP.
Basis Type
The type of moving average to be used as the Basis for the BBW component of the BBWP.
BBWP Lookback
The lookback period to be used in calculating the BBWP itself.
BBWP Plot settings
The BBWP plot settings give a choice between a user defined solid color, and a choice of "Blue Green Red", or "Blue Red" spectrum palettes.
Moving Averages
Has 2 Optional User definable and adjustable moving averages of the BBWP.
Visual Alerts
Optional User adjustable High and low Signal columns.
How to read the BBWP :
A BBWP read of 95 % ... means that the current BBW level is greater than 95% of the lookback period.
A BBWP read of 5 % .... means that the current BBW level is lower than 95% of the lookback period.
Proposed interpretations :
When the BBWP gets above 90 % and particularly when it hits 100% ... this can be a signal that volatility is reaching a maximum and that a macro High or Low is about to be set.
When the BBWP gets below 10 % and particularly when it hits 0% ...... this can be a signal that volatility is reaching a minimum and that there could be a violent range breakout into a trending move.
When the BBWP hits a low level < 5 % and then gets above its moving average ...... this can be an early signal that a consolidation phase is ending and a trending move is beginning.
When the BBWP hits a high level > 95 % and then falls below its moving average ... this can be an early signal that a trending move is ending and a consolidation phase is beginning.
Essential knowledge :
The BBWP was designed with the daily timeframe in mind, but technical analysists may find use for it on other time frames also.
High and Low BBWP readings do not entail any direction bias.
Deeper Concepts :
In finance, “mean reversion” is the assumption that a financial instrument's price will tend to move towards the average price over time.
If we apply that same logic to volatility as represented here by the Bollinger band width percentile, the assumption is that the Bollinger band width percentile will tend to contract from extreme highs, and expand from extreme lows over time corresponding to repeated phases of contraction and expansion of volatility.
It is clear that for most assets there are periods of directional trending behavior followed by periods of “consolidation” ( trading sideways in a range ).
This often ends with a tightening range under reducing volume and volatility ( popularly known as “the squeeze” ).
The squeeze typically ends with a “breakout” from the range characterized by a rapid increase in volume, and volatility when price action again trends directionally, and the cycle repeats.
Typical Use Cases :
The Bollinger Band Width Percentile may be especially useful for Options traders, as it can provide a bias for when Options are relatively expensive, or inexpensive from a Volatility (Vega) perspective.
When the Bollinger Band Width Percentile is relatively high ( 85 percentile or above ) it may be more advantageous to be a net seller of Vega.
When the Bollinger Band Width Percentile is relatively low ( 15 percentile or below ) it may be advantageous to be net long Vega.
Here we examine a number of actionable signals on BTCUSD daily timeframe using the BBWP and a momentum oscillator ( using the TSI here but can equally be used with Bollinger bands, moving averages, or the traders preferred momentum oscillator ).
In this first case we will examine how a spot trader and an options trader could each use a low BBWP read to alert them to a good potential trade setup.
note: using a period of 30 for both the Bollinger bands and the BBWP period ( approximately a month ) and a BBWP lookback of 350 ( approximately a year )
As we see the Bollinger Bands have gradually contracted while price action trended down and the BBWP also fell consistently while below its moving average ( denoting falling volatility ) down to an extremely low level <5% until it broke above its moving average along with a break of range to the upside ( signaling the end of the consolidation at a low level and the beginning of a new trending move to the upside with expanding volatility).
In this next case we will continue to follow the price action presuming that the traders have taken or locked in profit at reasonable take profit levels from the previous trade setup.
Here we see the contraction of the Bollinger bands, and the BBWP alongside price action breaking below the BB Basis giving a warning that the trending move to the upside is likely over.
We then see the BBWP rising and getting above its moving average while price action fails to get above the BB Basis, likewise the TSI fails to get above its signal line and actually crosses below its zeroline.
The trader would normally take this as a signal that the next trending move could be to the downside.
The next trending move turns out to be a dramatic downside move which causes the BBWP to hit 100% signaling that volatility is likely to hit a maximum giving good opportunities for profitable trades to the skilled trader as outlined.
Limitations :
Here we will look at 2 cases where blindly taking BBWP signals could cause the trader to take a failed trade.
In this first example we will look at blindly taking a low volatility options trade
Low Volatility and corresponding low BBWP levels do not automatically mean there has to be expansion immediately, these periods of extreme low volatility can go on for quite some time.
In this second example we will look at blindly taking a high volatility spot short trade
High volatility and corresponding high BBWP levels do not automatically mean there has to be a macro high and contraction of volatility immediately, these periods of extreme high volatility can also go on for quite some time, hence the famous saying "The trend is your friend until the end of the trend" and lesser well known, but equally valid saying "never try to short the top of a parabolic blow off top"
Markets are variable and past performance is no guarantee of future results, this is not financial advice, I am not a financial advisor.
Final thoughts
The BBWP is an improvement over the BBW in my opinion, and is a novel, and useful addition to a Technical Analysts toolkit.
It is not a standalone indicator and is meant to be used in conjunction with other tools for direction bias, and Good Risk Management to base sound trades off.
John Bollinger has suggested using Bolliger bands, and its related indicators with two or three other non-correlated indicators that provide more direct market signals.
He believes it is crucial to use indicators based on different types of data.
Some of his favored technical techniques are moving average divergence/convergence (MACD), on-balance volume and relative strength index (RSI).
Thanks
Massive respect to John Bollinger, long-time technician of the markets, and legendary creator of both the Bollinger Bands® in the 1980´s, and the Bollinger band Width indicator in 2010 which this indicator is based on.
His work continues to inspire, decades after he brought the original Bollinger Bands to the market.
Much respect also to Eric Crown who gave me the fundamental knowledge of Technical Analysis, and Options trading.

2 Multi-Timeframe Bollinger BandsThis is two separate Bollinger bands in one study. Customizable middle BB line type ( SMA , EMA , VWMA ), legnth, colors, and deviations provided at .5 increments.
Someone else has a very similar Bollinger Band study but the code was hidden, so I figured I would remake as a learning challenge since I'm new to pinescript and this is the best way to learn it imo.
There will be updates to this script in the future but for now it serves its purpose lol. Publishing this version early as I wanted to give some friends access to it
In terms of usage, I like 4h 50 SMA alot . Having two sets of Bollinger bands is nice so you can turn one off or swap between time frames and such. In terms of techniques using both bbands, I haven't really played with it too much yet but simple things like 1h 50sma bbands expanding past the 4h 50sma bbands probably indicate an exaggerated move in that specific time frame, etc etc.
Hope this helps!

Bollinger Bands Bar ColoringThis is a simple script that colors bars/candles based on where price is relative to the basis, and the upper and lower bands of the Bollinger Bands.
If price is above the basis, candles will be colored green, and if price is below the basis, candles will be colored red.
If price is outside of the bands on either side, the candles will be colored a darker shade of either color depending on if it is above or below.
I created this indicator because I like that at a glance I can have an idea of the bullishness or bearishness of price action based on the Bollinger Bands, without actually having the Bands overlayed on my charts.
It's also quite nice because I find that the areas where there is a shift in candle color (especially from green to red and vice versa) aid in identifying levels of support and resistance, and shifts in market structure.
I have another indicator that is a huge modification of the Bollinger Bands %B, which includes the candle coloring (and MAs), but this frees up space on my chart while still providing me with the primary information I'm looking for.

VWMACDV2 w/Intraday Intensity Index Histogram & VBCB Hello traders! In this script i tried to combine Kıvanç Özbilgiç's Volume Based Coloured Bars, Volume Weighted Macd V2 and Intraday Intensity Index developed by Dave Bostian and added to Tradingview by Kıvanç Özbilgiç. Let's see what we got here;
VBCB, Paints candlestick bars according to the volume of that bar. Period is 30 by default. If you're trading stocks, 21 should be better.
Volume Weighted Macd V2, "Here in this version; Exponential Moving Averages used and Weighted by Volume instead of using only vwma (Volume Weighted Moving Averages)." Says, Kıvanç Özbilgiç.
III, "A technical indicator that approximates the volume of trading for a specified security in a given day. It is designed to help track the activity of institutional block traders and is calculated by subtracting the day's high and low from double the closing price, divided by the volume and multiplied by the difference between the high and the low."
*Histogram of vwmacd changes color according to the value of III. (Green if positive, yellow if negative value)*
VWMACD also comes with the values of 21,13,3... Which are fibonacci numbers and that's how i use it. You can always go back to the good old 26,12,9.
Other options according to the fibonacci numbers might be= 21,13,5-13,8,3-13,8,5... (For shorter terms of trading)
Trading combined with the bollinger bands is strongly advised for both VWMACD and III. VBCB is just the candy on top :)
Enjoy!

Triple BB3 Bollinger Band Plots that are translucent in order to see where the bollinger bands align from 3 different resolutions.
Change the resolution to more closely represent the current chart. For example on a 1 hour chart you might choose Res1 as 30 minutes, Res2 as 1 hour, and Res3 as 2 hour.

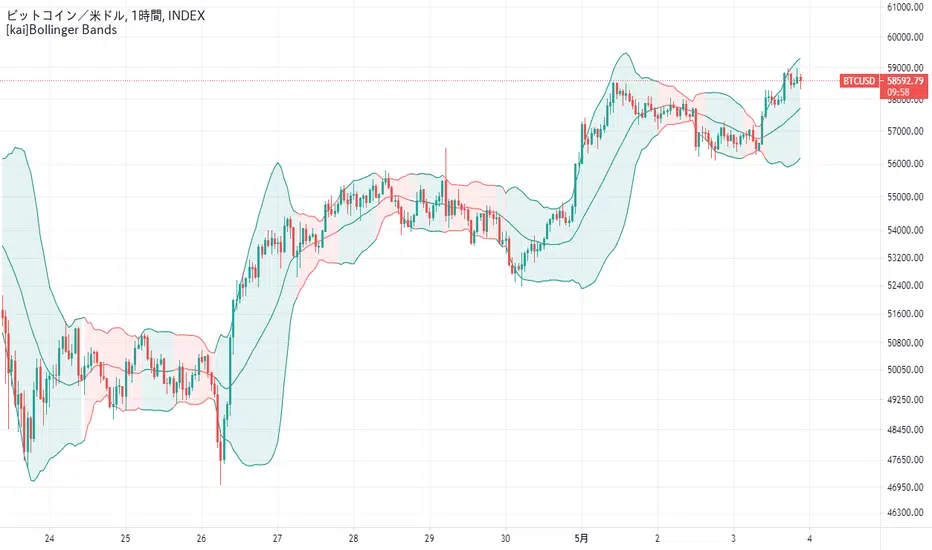
[kai]Bollinger BandsBollinger band compatible with log scale
You can display the squeezed part in red
ログスケールに対応したボリンジャーバンドです
スクイーズしたところを赤く表示することができます
EMA Ribbon Bollinger UltimateEma Ribbon and Bollinger Bands.
Background change color if the trend change or if it goes weak.

Squeeze Momentum [Plus]The "Momentum" in this indicator is smoothed out using linear regression. The Momentum is what is displayed on the indicator as a histogram, its purpose is obvious (to show momentum).
What is a Squeeze? A squeeze occurs when Bollinger Bands tighten up enough to slip inside of Keltner Channels .
This is interpreted as price is compressing and building up energy before releasing it and making a big move.
Traditionally, John Carter's version uses 20 period SMAs as the basis lines on both the BB and the KC.
In this version, I've given the freedom to change this and try out different types of moving averages.
The original squeeze indicator had only one Squeeze setting, though this new one has three.
The gray dot Squeeze, call it a "low squeeze" or an "early squeeze" - this is the easiest Squeeze to form based on its settings.
The orange dot Squeeze is the original from the first Squeeze indicator.
And finally, the yellow dot squeeze, call it a "high squeeze" or "power squeeze" - is the most difficult to form and suggests price is under extreme levels of compression.
Now to explain the parameters:
Squeeze Input - This is just the source for the Squeeze to use, default value is closing price.
Length - This is the length of time used to calculate the Bollinger Bands and Keltner Channels .
Bollinger Bands Calculation Type - Selects the type of moving average used to create the Bollinger Bands .
Keltner Channel Calculation Type - Selects the type of moving average used to create the Keltner Channel.
Color Format - you to choose one of 5 different color schemes.
Draw Divergence - Self explanatory here, this will auto-draw divergence on the indicator.
Gray Background for Dark Mode - to make them more visually appealing.
Added ADX (Average Directional Index) that measure a trend’s strength. The higher the ADX value, the stronger the trend. The ADX line is white when it has a positive slope, otherwise it is gray. When the ADX has a very large dispersion with respect to the momentum histogram, increase the scale number.
Added "H (Hull Moving Average) Signal". Hull is a extremely responsive and smooth moving average created by Alan Hull in 2005. Have option to chose between 3 Hull variations.
Added "Williams Vix Fix" signal. The Vix is one of the most reliable indicators in history for finding market bottoms. The Williams Vix Fix is simply a code from Larry Williams creating almost identical results for creating the same ability the Vix has to all assets.
The VIX has always been much better at signaling bottoms than tops. Simple reason is when market falls retail traders panic and increase volatility, and professionals come in and capitalize on the situation. At market tops there is no one panicking... just liquidity drying up.
The FE green triangles are "Filtered Entries"
The AE green triangles are "Aggressive Filtered Entries"

Projected Bollinger Bands - Quadratic RegressionBased on the work of Alex Groove : https://www tradingview com/script/YnoXd2AY-forecasting-quadratic-regression/
and also based on https://www tradingview com/script/YnoXd2AY-forecasting-quadratic-regression/ by capissimo
Notes:
1. This Bollinger Bands uses the QREG as its middle line (not MA as the original Bollinger Bands) so this should be acknowledged.
2. This indicator forecasts 3 candles (periods) ahead.
3. The label's position is quite messy, so you need to adjust the chart zoom in order to make the indicator doesn't overlap anything.
4. You need to manually set the time frame in the indicator settings because i'm not able to make the indicator recognizes it automatically
I'm trying to make the Bollinger Bands Forecasting from Quadratic Regression, and i'm really sure that there are a lot of mistakes here and there, so i 'm hoping corrections coming from you guys...
CHEERS!!!

Bollinger Band Calculation ToolIntroducing the Bollinger Band Calculation Tool
What are Bollinger Bands ?
According to Investopedia ....
"In the 1980s, John Bollinger, a long-time technician of the markets, developed the technique of using a moving average with two trading bands above and below it.
Unlike a percentage calculation from a normal moving average, Bollinger Bands® simply add and subtract a standard deviation calculation.
Standard deviation is a mathematical formula that measures volatility, showing how the stock price can vary from its true value.
By measuring price volatility, Bollinger Bands® adjust themselves to market conditions.
This is what makes them so handy for traders; they can find almost all of the price data needed between the two bands."
Classic interpretations of Bollinger bands from Fidelity Investments....
"When the bands tighten during a period of low volatility, it raises the likelihood of a sharp price move in either direction.
This may begin a trending move. Watch out for a false move in opposite direction which reverses before the proper trend begins.
When the bands separate by an unusual large amount, volatility increases and any existing trend may be ending.
Prices have a tendency to bounce within the bands' envelope, touching one band then moving to the other band.
You can use these swings to help identify potential profit targets.
For example, if a price bounces off the lower band and then crosses above the moving average, the upper band then becomes the profit target.
Price can exceed or hug a band envelope for prolonged periods during strong trends.
On divergence with a momentum oscillator, you may want to do additional research to determine if taking additional profits is appropriate for you.
A strong trend continuation can be expected when the price moves out of the bands.
However, if prices move immediately back inside the band, then the suggested strength is negated."
This indicator contains a standard set of Bollinger Bands with the addition of a Test Closing Price calculation function.
It displays a standard set of Bollinger Bands by default.
How do I use the Test Closing Price function ?
Enter a test price in the Test Closing Price box in the settings, and then click the "Use Test Price" button.
The indicator will then replace the current Bollinger upper, lower and basis-lines with plots showing the resultant lines if price were to close at the Test Closing Price.
An information panel will appear which displays the test closing price and the resulting Bollinger-upper, Bollinger-lower and basis-line prices.
Can display up to 10 decimal places and has adjustable label offset.
It will also plot lines outlining the resultant closed candle body for clarity.
To return to "Standard Bollingers" just click off the "Use Test Price" button.
Knowing exactly what the Bollinger bands and Basis will do if a particular closing price is met can be useful in a variety of ways to traders who use Bollinger Bands® in their trading.
It is possible to work out exactly what closing price is required to get above or below a Bollinger band which is normally difficult as Bollingers react to the change in price.
Users can also experiment with different Test Closing Prices [/i to see exactly what effect this would have on the Basis moving average and on the Bollinger bands themselves.

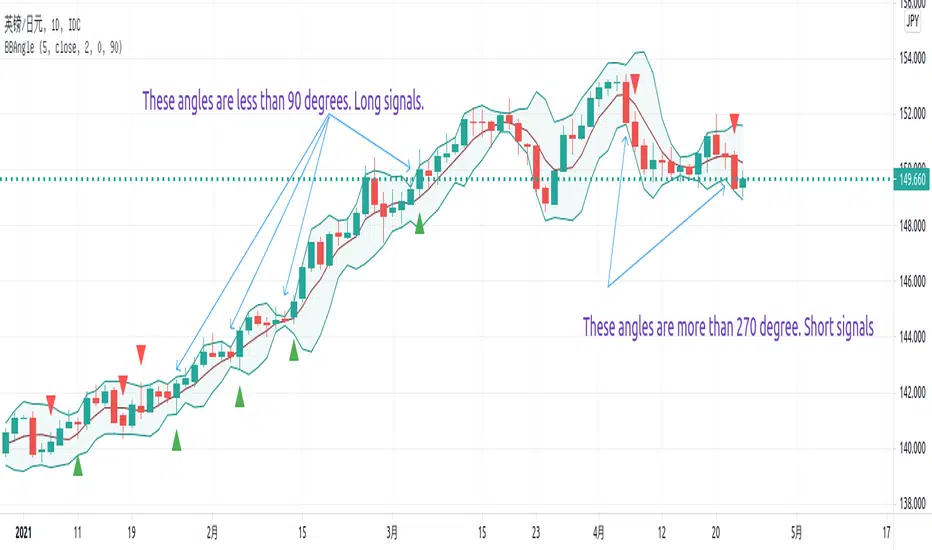
Angle of Bollinger Bands AlertThis script is used to calculate angle of Bollinger Bands and also setup alerts.
The angle is based on the rules:
- if the previous 2 is 1.1, previous 1 is 1, and the current is 1.1, then the angle should be 90 degrees.
- if the previous 2 is 0.9, previous 1 is 1, and the current is 0.9, then the angle should be 270 degrees
If upper angle is below 90 degrees and close is above the average, it is long signal.
If lower angle is above 270 degrees and close is below the average, it is short signal.
- It is good for catch trend trading.
- Not good for swing trading as the BB changes are very tiny but angles for upper may hit below 90 degrees or angle of lower may be above 270 degrees.
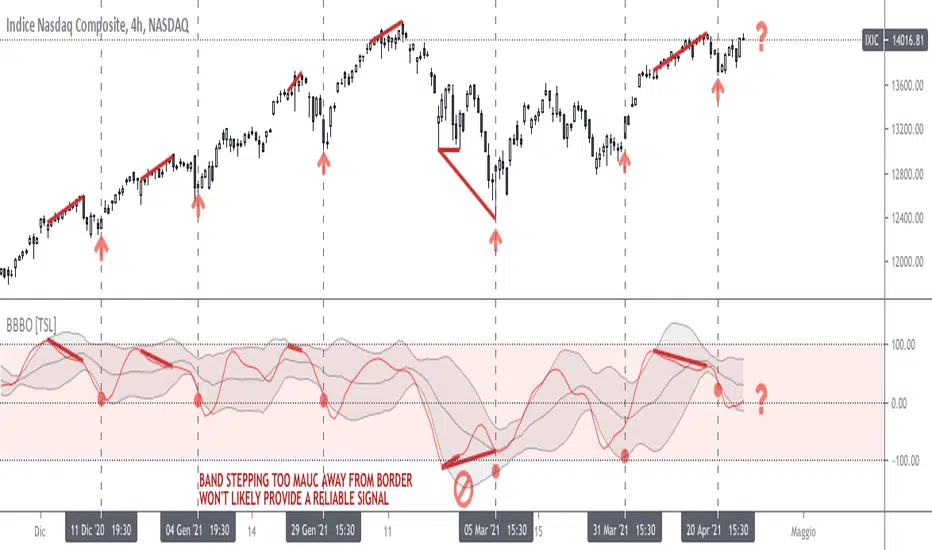
Bollinger on Bollinger OscillatorThis study is a user-friendly workaround to the BBOE+ (attached at the bottom).
I applied Bollinger Bands on BB Oscillator which spend his time bouncing between +100 -100 levels both representing extremes market conditions. You can use it to spot reliable entries/exits opportunities.
During an uptrend when the oscillator tends to -100 and the lower BB turn up you should consider a BUY. Do the same thing when the oscillator pushes under the lower BB nearby the Zero Line.
Make the opposite during a downtrend.
Also look for divergencies that occurs nearby the borders and BB squeezes too.
You can vary both the lenght for the Oscillator and BB.
Use “Upper Multiplier” and “Lower Multiplier” to set two different StDev from the basis (if you need).
You may also consider to apply an offset to the BB.
Is up to you to match the configuration that better-fits your market and time frame.
Default settings could well fits this IXIC 4H Chart.
So that this is basically a price-based indicator you would better consider to pair it with a volume-based or an absolute-momentum-based one.
SHARING IS INTENDED FOR EDUCATIONAL PURPOSE ONLY. NOT FOR PROFESSIONAL USE.
WILL APPRECIATE ANY FEEDBACK, QUESTION, SUGGESTION. (*)
(*) Please don’t ask me for “magic-setting” that do not exit, nor for “kaleidoscopic effects” cause I’m a big fan of such a minimalistic yet profession layouts.
FOLLOW UP TO CHECK UPDATES!
Baus BandsThe Baus Bands are a simplified version of another one of my trend following indicators, the Neapolitan Bands. This version only shows the trend trading zones in green and red. An additional 21 EMA with an ATR band was added as part of my own trend trading rules using these bands.
How do I read this indicator?
Is the blue band between and not touching the green or red clouds? The condition is ranging.
Is the blue band touching the green cloud? The condition is a bullish trend.
Is the blue band touching the red cloud? The condition is a bearish trend.
The trend trading rules are exactly the same as the default Neapolitans, but include an extra condition.
A trend has started once 2 conditions are met:
Price has entered either trending cloud.
The 21 EMA ATR band in blue is within the same cloud.
With those conditions met, if you expect the trend to continue, trade pull-backs to the blue band in the direction of the trending cloud.
Isn't this just a 21 EMA trading pull-backs strategy?
No. The 21 EMA alone is not sufficient in my opinion to define a range or trend technically. Always buying the 21 EMA pull-back, especially in a range, is not a great strategy by itself unless you've already identified price as trending. Baus Bands adds that trend identification.
Why make this?
Baus Bands show the conditions I personally use for catching trends and identifying ranges with these indicators, and shows only the information I use.
What's the purpose of the ATR band around the 21 EMA?
Sometimes price will open and close below the 21 EMA and cause some technical analysts will say the trend is over. I added the ATR specifically to get a volatility based, upper and lower bound range around the 21 EMA. that way I have an acceptable price range where price could move past the 21 EMA and still keep a trend valid using similar rules. I then saw that so long this ATR band (not the 21 EMA itself) was touching those trending clouds, then the trend has a good chance of continuing as long as that was true.

Roc & Atr
Roc & Atr Orders
My indicator, where I compare the 20 bar change percentage with the 14 bar atr band, I hope it will be useful to everyone. the green zones can be interpreted as BUY and the red zone as SELL zone. In graphs with high motion and low atr, the channel narrowing can be interpreted as BUY and the channel opening as SELL.
No indicator shows you the right way ... The best way is your own thoughts

Overlay Indicators (EMAs, SMAs, Ichimoku & Bollinger Bands)This is a combination of popular overlay indicators that are used for dynamic support and resistance, trade targets and trend strength.
Included are:
-> 6 Exponential Moving Averages
-> 6 Simple Moving Averages
-> Ichimoku Cloud
-> Bollinger Bands
-> There is also a weekend background marker ideal for cryptocurrency trading
Using all these indicators in conjunction with each other provide great confluence and confidence in trades and price targets.
An explanation of each indicator is listed below.
What Is an Exponential Moving Average (EMA)?
"An exponential moving average (EMA) is a type of moving average (MA) that places a greater weight and significance on the most recent data points. The exponential moving average is also referred to as the exponentially weighted moving average. An exponentially weighted moving average reacts more significantly to recent price changes than a simple moving average (SMA), which applies an equal weight to all observations in the period.
What Does the Exponential Moving Average Tell You?
The 12- and 26-day exponential moving averages (EMAs) are often the most quoted and analyzed short-term averages. The 12- and 26-day are used to create indicators like the moving average convergence divergence (MACD) and the percentage price oscillator (PPO). In general, the 50- and 200-day EMAs are used as indicators for long-term trends. When a stock price crosses its 200-day moving average, it is a technical signal that a reversal has occurred.
Traders who employ technical analysis find moving averages very useful and insightful when applied correctly. However, they also realize that these signals can create havoc when used improperly or misinterpreted. All the moving averages commonly used in technical analysis are, by their very nature, lagging indicators."
Source: www.investopedia.com
Popular EMA lookback periods include fibonacci numbers and round numbers such as the 100 or 200. The default values of the EMAs in this indicator are the most widely used, specifically for cryptocurrency but they also work very well with traditional.
EMAs are normally used in conjunction with Simple Moving Averages.
" What Is Simple Moving Average (SMA)?
A simple moving average (SMA) calculates the average of a selected range of prices, usually closing prices, by the number of periods in that range.
Simple Moving Average vs. Exponential Moving Average
The major difference between an exponential moving average (EMA) and a simple moving average is the sensitivity each one shows to changes in the data used in its calculation. More specifically, the EMA gives a higher weighting to recent prices, while the SMA assigns an equal weighting to all values."
Source: www.investopedia.com
In this indicator, I've included 6 popular moving averages that are commonly used. Most traders will find specific settings for their own personal trading style.
Along with the EMA and SMA, another indicator that is good for finding confluence between these two is the Ichimoku Cloud.
" What is the Ichimoku Cloud?
The Ichimoku Cloud is a collection of technical indicators that show support and resistance levels, as well as momentum and trend direction. It does this by taking multiple averages and plotting them on the chart. It also uses these figures to compute a "cloud" which attempts to forecast where the price may find support or resistance in the future.
The Ichimoku cloud was developed by Goichi Hosoda, a Japanese journalist, and published in the late 1960s.1 It provides more data points than the standard candlestick chart. While it seems complicated at first glance, those familiar with how to read the charts often find it easy to understand with well-defined trading signals."
More info can be seen here: www.investopedia.com
I have changed the default settings on the Ichimoku to suit cryptocurrency trading (as cryptocurrency is usually fast and thus require slightly longer lookbacks) to 20 60 120 30.
Along with the Ichimoku, I like to use Bollinger Bands to not only find confluence for support and resistance but for price discovery targets and trend strength.
" What Is a Bollinger Band®?
A Bollinger Band® is a technical analysis tool defined by a set of trendlines plotted two standard deviations (positively and negatively) away from a simple moving average (SMA) of a security's price, but which can be adjusted to user preferences.
Bollinger Bands® were developed and copyrighted by famous technical trader John Bollinger, designed to discover opportunities that give investors a higher probability of properly identifying when an asset is oversold or overbought."
This article goes into great detail of the complexities of using the Bollinger band and how to use it.
=======
This indicator combines all these powerful indicators into one so that it is easier to input different settings, turn specific tools on or off and can be easily customised.

SMA&BOLL脚本用来将sma和布林带统一呈现, 方便及时捕捉价格的走势与波动区间. 只要简单地修改SMA的两条线, 布林带的中间线同时作为SMA的第三条长周期参考线也作为布林带的基础计算曲线, 一线双用节省资源.
The script is used to present the sma and Bollinger bands in a unified manner, which is convenient to capture the price trend and fluctuation range in time. Just simply modify the two lines of the SMA, and the middle line of the Bollinger bands serves as the third long-period reference line of the SMA and also serves as the Bollinger bands The basic calculation curve, one-line dual-use saves resources.

GSO + RSI + MACD + MFI + Bollinger BandsThis script uses a Gann Swing Oscillator , RSI , MACD , MFI and Bollinger Bands to generate long and short signals for cryptocurrencies on the 5 minute chart.
The Gann Swing Oscillator was inspired by HPotter's GSO.
This script is for educational purposes only. This script is NOT to be used as financial advice. I will not accept liability for any losses which may occur as a result of using this script.
