Fractal Breakout Strategy [KL]Fractal Breakout Strategy
This strategy will enter into a Long position when (a) bullish fractal is formed, combined with (b) ATR is relatively low. Trailing stop loss is set based on ATR.
Bullish fractal pattern :
A bullish fractal pattern looks like this:
It is formed when lower-low has reached a local minimum followed by higher-lows.
By default, this script plots the pivot point (the local minimum) using green crosses. This line will extend to the right until the next bullish fractal is formed. The local minimum pivot point is considered as key level of support. For long position entry, entry price must be higher or equal to it.
On the other hand, a bearish fractal pattern looks like the exact opposite. Reversing the logic, it is a local maximum indicated by higher-highs followed by lower-highs. This is shown by red crosses.
Why use ATR to confirm entry :
Two reasons to enter when ATR is low:
1) Since trailing stop loss is based on ATR, entering the market when ATR is low means risking less for potentially high reward.
2) Low ATR often signals price consolidation. There are two favorable scenarios, either: (i) period of accumulation, or (ii) bull flag, ideally followed by breakout.
Determining whether ATR is low :
Relative lows are quantified out by using the method in my other script: Modified ATR Indicator
The method involves applying two-tailed hypothesis testing to assess whether ATR (ie. by default lookback period of 5) has greatly deviated from a larger sample size (ie. lookback period of 50). Assuming ATR is normally distributed and variance is known, then test statistic (z) can be used to determine whether ATR5 is within the critical area under Null Hypothesis: ATR5 == ATR50. If z falls below/above the left/right critical values (ie. 1.645 for a 90% confidence interval), then ATR is determined to the relatively low/high respectively. For the purpose of assessing whether ATR is low, the left-tail is the main focus.
Profit taking :
Profits by default are taken over 3 levels based on risk to reward ratio (ie. 1R, 2R, 3R). When a target is met at each level, strategy will close out one third of current position size. Remainders (ie. already taken once at 1R, but not yet reaching 2R or 3R) will eventually be closed at the trailing stop loss price.
빌 윌리엄스 인디케이터

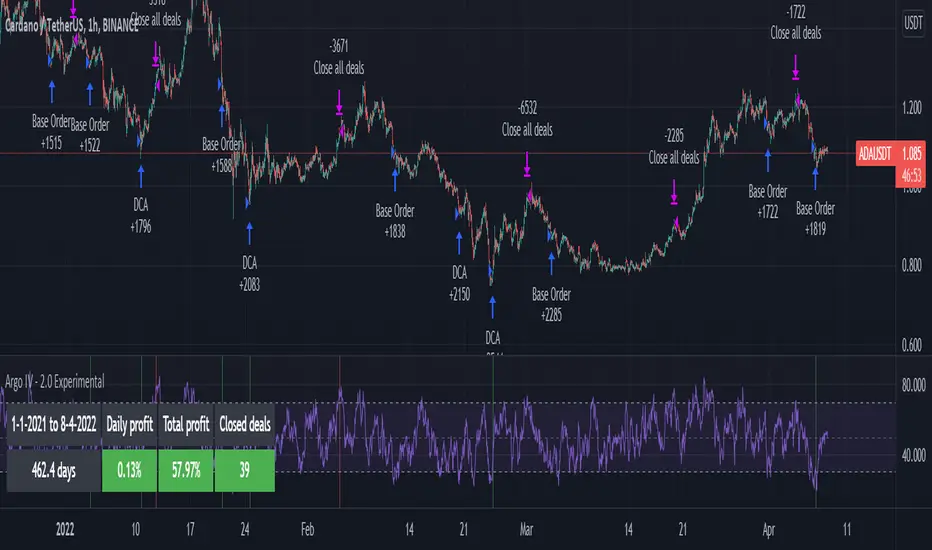
Argo IV - EXPERIMENTAL strategy for 3commas with alertsThis strategy lets users create BUY/SELL alerts for 3commas single bots in a simple way, based on a built in set of indicators that can be tweaked to work together or separately through the study settings. Indicators include Bollinger Bands , Williams %R , RSI , EMA , SMA , Market Cipher, Inverse Fisher Transform, RSI divergence.
It is based on the ARGO I study ( here ), with the following major differences:
- It uses pyramiding (see strategy "properties")
- It includes a lot of new options for deal start/close conditions for maximum control
- It doesn't require any external tool to backtest.
If the user choses to create both BUY and SELL signals from the study settings, the alert created will send both BUY and SELL signals for the selected pair. Note the script will only send alerts for the pair selected in the study settings, not for the current chart (if different).
Important : it is only an early experiment, I will only release the script when satisfied with performance. Until then, I advise not to use this for any real trading.
How to use:
- Add the script to the current chart
- Open the strategy settings , insert bot details. Pairs MUST be in capital letters or 3commas will not recognize them.
- Still in the settings, tweak the deal start/close conditions from various indicators until happy. The strategy will plot the entry / exit points on the chart
- When happy, right click on the "..." next to the study name, then "Add alert'".
- Under "Condition", on the second line, chose "Any alert () function call". Add the webhook from 3commas, give it a name, and "create".
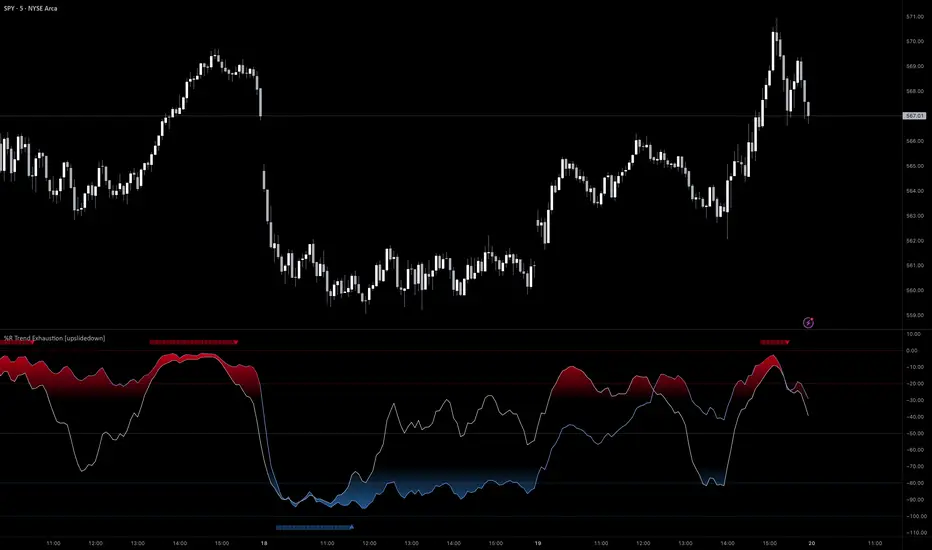
%R Trend Exhaustion [upslidedown]I love Williams %R! This indicator mixes two %R periods... a standard %R with a longer period %R. The longer period of 112 has interesting results for trend following strategies in the crypto market through backtesting.
Alone these are fairly ordinary but together they provide a very interesting trend exhaustion/reversal system while filtering out some noise. I have highlighted key areas of interest with filled boxes. An "area of interest" is when there is confluence between the short and long period %R values along with being overbought or oversold. Once there is a break in the overbought or oversold trend, an arrow will print.
This is one of my odder ideas that appears to have some merit and detects interesting tops or bottoms (or confirms a trend reversal) so I'm publicly publishing for the community to find. If you find this useful please reach out and let me know how you use it as it's fairly unique... and thus different than anything I've ever seen or used.
Argo II - (alerts for 3commas composite bots) - publicThis script lets users create BUY/SELL alerts for 3commas composite bots (1 alert = 12 pairs) in a simple way, based on a built in set of indicators that can be tweaked to work together or alone through the study settings.
There is a version of this script for single pair bots, with slightly more features here .
If the user choses to create both BUY and SELL signals from the study settings, the (1) alert created will send both BUY and SELL signals for all 12 pairs selected. At this stage, the script forces the user to select 12 pairs in the study settings. If less pairs are inserted, it will not work. Also, the script will only send alerts for the pairs selected in the study settings, not for the current chart (if different).
How to use:
- Add the script to the current chart
- Open the study settings , insert bot details and select 12 pairs. You should write the pairs manually, using the format BTC , ADA, ETH, etc. They MUST be in capital letters or 3commas will not recognize them.
- Still in the study settings, tweak the deal start/close conditions from various indicators until happy. The study will plot the entry / exit points below the current chart (1 = buy, 2 = sell)
- Make sure your strategy works for all the pairs you have selected, simply by checking each chart with the same study settings
- When happy, right click on the "..." next to the study name, then "Add alert'".
- Under "Condition", on the second line, chose "Any alert () function call". Add the webhook from 3commas, give it a name, and "create".
That's it.
Notes:
- If you insert coins that are not available for the quote currency and exchange of your choosing, the script will not work and return an error.
- Make sure you run tests with paper trading or dummy bots (i.e without actual bot ID) to ensure your alerts trigger as intended on all coins.
- If alerts trigger too much (i.e they all trigger at the same time for all coins), Trading View will stop the alert. So probably not ideal for a scalping bot. It could also be the sign the script doesn't work as intended.
- The script is a bit slow on my side. I am a beginner in pinescript, so if anyone knows how to simplify it, please let me know.
- if anyone knows how to tell the script to function with less than 12 pairs (when not filling the 12 fields in the setting), please also let me know :)
EneX SignalEneX is signal that give recommendation signals for entry and exit on spot market. This indicators not suitable for leverage trading in futures market.
EneX signal consider several indicators and has entry and exit rules.
EneX signal is suitable for investors who believe in trend following strategy (disclaimer on).
This script composed by Yohan Naftali for educational purpose only. Reader who will use this signal must do own research.
Indicator and Plot Involved
1. Williams Fractals with default periods = 2
2. William Alligator Indicators with default simple moving average 8, 13, and 21
3. Exponential Moving Averages with default value EMA 50, 100, and 200
4. Relative Strength Index with default overbought level = 80 and oversold level = 20
5. Williams Fractals are joined to create support and resistance line and fill area between support and resistance lines.
Entry signal conditions
1. Entry on Weakness when bullish fractal appear on n/2 period
2. Entry when price break resistance line
All entry condition must above EMA and alligator signal and not in overbought RSI
Exit signal conditions
1. Lowest price is below Exponential Moving Average
2. Lowest price is below William alligator lines
You can easily find entry and exit points by using Entry (E), Exit(X) signals
How to use
1. Monitor chart and wait until E or X signals
2. Entry if Entry Signal (E) appear (green colored label)
3. Exit if Exit Signal (X) appear (red colored label)
4. Change indicators setting when necessary
Best Practice
1. Entry only when entry signal (E) appear
2. Never entry when price below William alligator signal
3. Exit when exit signal (X) appear
4. Not exit when exit signal appear when you believe or you have information that price will be rebound
5. Exit if you believe that current price meet your target price
6. Always wise when use EneX signals
Disclaimer
Do your own research and consider fundamental price of asset.
The indicators provided on this script is for educational purposes only.
Author does not offer advisory or brokerage services, nor does it recommend or advise users to buy or sell particular stocks or securities.
Please examined script and give feedback for further improvement.

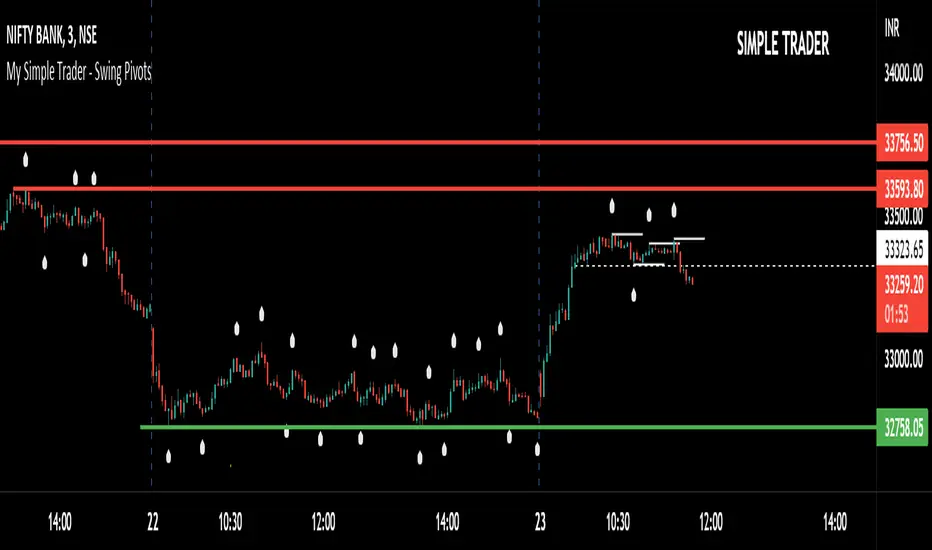
Simple Trader - Swing PivotsSimple Trader - Swing Pivots.
Note: Do not use this indicator as buy/sell signals.
I'm using this indicator to see the visible reversal points in chart.
I use 5 candles preceding and 5 candles following in 3 mins chart to analyze the trend and momentum.
I use 2 candles preceding and 2 candles following in 30 mins chart to analyze the trend and momentum.
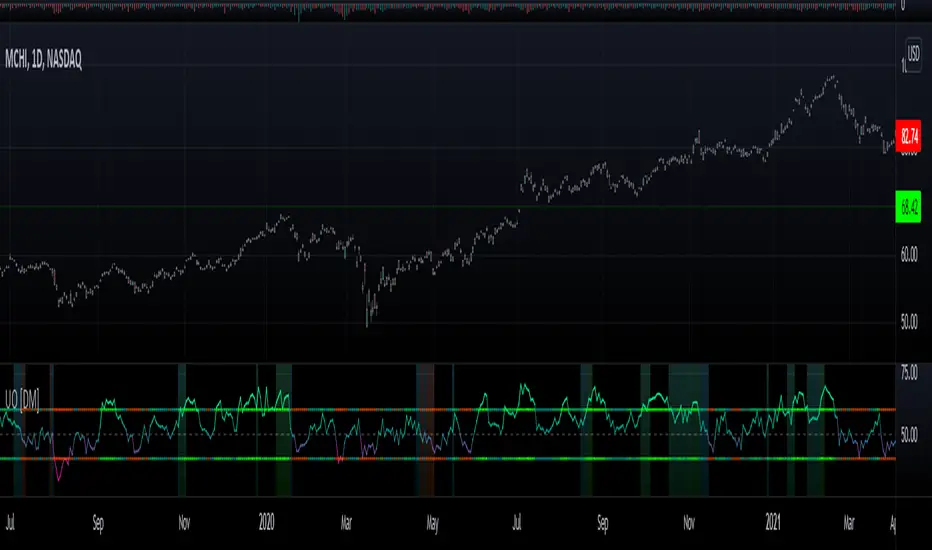
Willians Ultimate Oscillator [DM]Hello colleagues
I share the Williams Ultimate Oscillator
You can select betwen:
1.Average signal of 9 lengths (3 X UO).
2. Three independent signals UO.
You can also customize the oversold and oversold bands.
Some alerts were added.
The gradient colors of the background warn us of a squeeze in the movement of the indicator.
If there is something that can be improved (it is certain that it is) please leave it in comments.
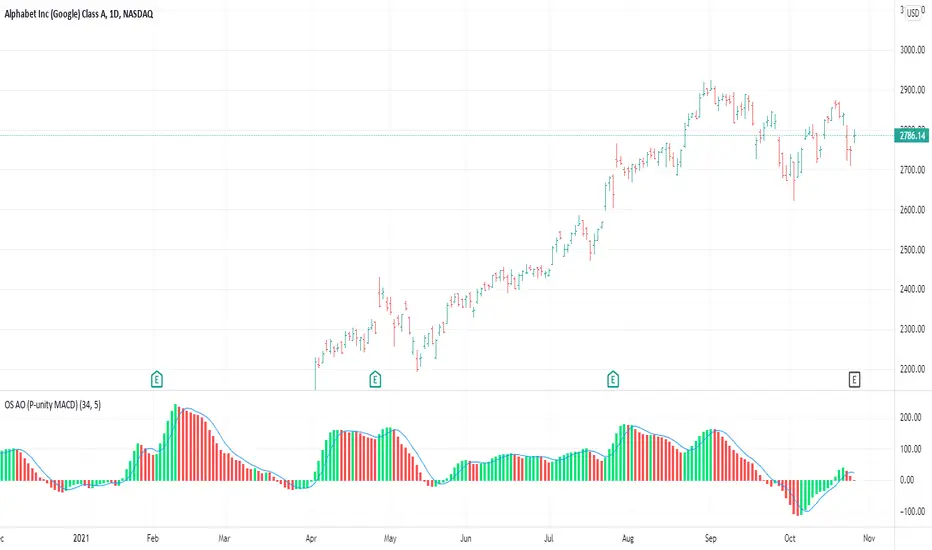
OS AO (P-unity MACD)This is both the Awesome Oscillator (AO) as described in New Trading Dimensions ( NTD , book by Bill Williams ), and the Profitunity MACD described in the first edition of Trading Chaos.
The calculation for both is the same. In this case I added the 5 day SMA which is the blue line. The difference between the blue line and the AO is the AC which is also described in NTD and is usually plotted in a different indicator (AC).
This is the base for the following signals:
Zone Bar
2nd Wise Man
The signals are triggered and shown on the main chart screen through the use of OS Alligator . This indicator (AO) provides further insight in analyzing those signals by reading the AO, its current position and evolution directly.
Forex Fractal EMA ScalperThis is a forex scalper designed for very short timeframes 1-5 min max.
At the same time due to the short timeframe, is recommend to re optimize it weekly .
Its components are
Fractals
Triple EMA with different lengths
Rules for entry:
For long : we have an up fractal and all 3 ema are in ascending order
For short: we have a down fractal and all 3 ema are in descending order.
Rules for exit
We exit when we either get a reverse order or when we hit the take profit or stop loss calculated in fixed pips.

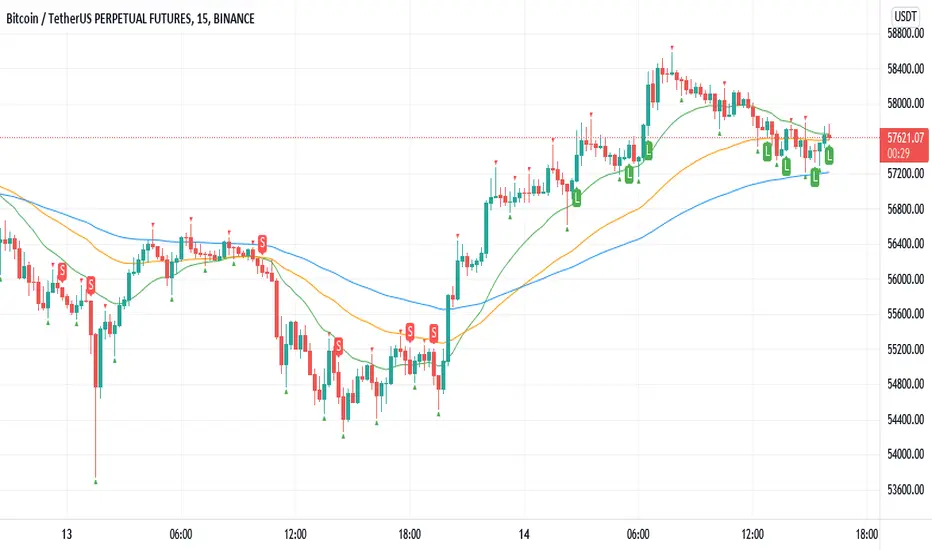
Williams Fractals BUY/SELL signals indicatorThis indicator made with using Williams Fractals, 20 50 100 Moving Averages and Relative Strength Index. You can easily find entry points by using Long (L), Short (S) signals.
This is a 15min scalping strategy for BTC:USDT Perpetual pair. For use different pairs or TFs you may need to change settings.
How to use
****************
When flashing Long (L) or Short (S) signal you should wait until the candle closing for the confirmation.
After that candle closed with the signal, you can enter a trade in next candle opening.
Your SL should be 3.1% from etnry and TP should be 0.5% from entry for best results. (You can use Long Position / Short Position tool in Prediction and Measurement Tools in drawing pannel to calculate this. This settings only for BTC:USDT Perp 15 min TF. For other TFs or Pairs settings may vary. You can easily change these settings and backtest your own.)
After entering a trade you can be ignored next signals until close the trade.
To learn more about this strategy, please try the "Williams Fractals Strategy" I coded. Thank you!
Rainbow FractalsThis Indicator uses the Bill Williams Fractals with coloring based on the Peak High/Low of the most recent RSI Value.
This helps quickly identify RSI bearish and bullish divergence without having a RSI lower indicator loaded onto the chart.
When the RSI is between 40 and 60 no fractals are posted. Lighter colored fractals are closer to a RSI value of 50 and darker fractals or further away from a RSI value of 50.

Argo I (alerts for 3commas single bots)This script lets users create BUY/SELL alerts for 3commas single bots in a simple way, based on a built in set of indicators that can be tweaked to work together or separately through the study settings. Indicators include Bollinger Bands, Williams %R, RSI, EMA, SMA , Market Cipher, Inverse Fisher Transform.
If the user choses to create both BUY and SELL signals from the study settings, the alert created will send both BUY and SELL signals for the selected pair. Note the script will only send alerts for the pair selected in the study settings, not for the current chart (if different).
How to use:
- Add the script to the current chart
- Open the study settings , insert bot details. Pairs MUST be in capital letters or 3commas will not recognize them.
- Still in the study settings, tweak the deal start/close conditions from various indicators until happy. The study will plot the entry / exit points below the current chart (1 = buy, 2 = sell)
- Ideally, test the settings with a backtesting script. The present script is compatible with the Trading Parrot's backtester.
- When happy, right click on the "..." next to the study name, then "Add alert'".
- Under "Condition", on the second line, chose "Any alert () function call". Add the webhook from 3commas, give it a name, and "create".
Happy tweaking!

Williams Fractals StrategyThis indicator made with using Williams Fractals, 20 50 100 Moving Averages and Relative Strength Index. You can easily find entry points by using Long (L), Short (S) signals.
Note : Settings are optimized for BTC:USDT Perpetual 15min TF. For use different pairs or TFs you may need to change settings.

Hotch v1.02 RSI+Fractals/VWAP Bands/Smoothed Moving Average. In this script the RSI is used the limit number of displayed fractals to only those fractals that are triggered in the RSI Overbought and Oversold areas. This helps keep the chart cleaner looking when combined with other indicators so other icons that are plotted above and below candles are not covered up.
For example if the RSI drops below 30 the next fractal would be displayed.
If the RSI stays below 30 each fractal would be displayed.
If the RSI dips below 30 and returns above 30 before there is a fractal is displayed, the next valid fractal would still be displayed.
With optimization of the RSI values this indicator can be used in confluence with the included VWAP bands and Moving average to find trend reversal entry points for trades. Also recommended is to use a divergence identifying lower indicator as a secondary confirmation of trade entry.
Example of a potential long entry using the displayed chart.
1) RSI under 30
2) Price was recently outside of your chosen VWAP multiple.
3) a fractal was triggered.
Additionaly:
4) Use other indicators or other confluences for a stronger trade signal.
5) Use your preferred method of determining entry price stop loss and take profit.
NOTE: Fractals normally paint two bars behind the current bar. In this code, with the combination of the RSI and Fractal Trigger, the fractal paints an icon on the current bar.

Fractal Corridors BacktestFractal Corridors is a strategy developed a used by Vladimir Poltoratskiy. You can learn about this in his books from the series Trading Code Is Open which I recommend reading.
The strategy allegedly works best in a high-liquidity environment with little to no impactful events. The author likes to trade EURUSD, Copper, and USDCAD, I think, was another pair.
Logic is based on his 3-bar fractals and their fractures as they come. Basically, if the fractal level gets broken by a certain number of ticks (usually 6 - 14% Average Daily Range), a corridor is built and stop-market entry will be filled.
There are other rules you will find in the book. Most importantly - avoid trading during events and extremely choppy symbols which seem to follow no logic.
Lastly, the script includes 5 different definitions of Fractal Corridor. I think Mode 5 is the correct one but I was unable to confirm that exactly as it gets a little tricky. I am willing to disclose this part of the code to other Pinecoders, but it will not be available for everyone, because that could discourage people from getting the book.
Thanks to @mincho1010 for help with testing different versions as I worked on the script.
Have a good day!
Fx Crusher Scalping Indicator V1█ OVERVIEW
Scalping Indicator with Buy and Sell Signals for the 15 min and 5 min Chart. Works on all assets (Crypto, Forex, Stocks, Indices, Commodities and Metals)
Only use in trending markets. Signals in a ranging market are useless.
This Scalping Indicator is different from others because most of the Buy/ Sell signals actually make sense. No counter trend trading and most signals can be very profitable when used right.The single most important goal was to have an indicator that shows signals with a big possible risk reward ratio. Most false signals are filtered out. The Fx Crusher Scalping Indicator is not perfect but it is amazing. You can customize the indicator to get the highest signal quality.
█ HOW DOES IT WORK?
The indicator determines the trend direction by using 3 different smoothed moving averages. A green background shows an uptrend and a red background shows a downtrend.
The strength of the trend is determined by the slope of the individual SMMAs. You can set the slope of every single SMMA for buys and sells individually.
The indicator only shows signals when there is a clear trend on the current timeframe.
Entry signals are generated by a combination of Williams fractals, SMMA crossover, trend angle and RSI condition.
█ HOW TO USE?
Draw Support & Resistance lines on the 4H Chart
Determine the overall trend on the 1H Timeframe
Go to the 15 min or 5 min Time Frame and have a look at the signals
Adjust the slope of every single SMMA in 0.01 steps until the signals look good
Adjust the RSI settings for overbought and oversold condition if necessary
Only enter a trade after the candle that prints a signal is closed.
Only take buy positions when all SMMAs are going up and don’t touch each other
Only take sell positions when all SMMAs are going down and don’t touch each other
Only use this Scalping Indicator with proper Risk management and a risk reward ratio of around 1:2.
Trail your stop to get the most pips out of the signals. Very often the indicator shows signals right before major moves.
█ ADDITIONAL INFO
Be careful with buy signals when the market on the higher timeframe (4H and 1H) is in a downtrend and vice versa.
You can make the most profit out of this Indicator when you enter with 2 positions. A quick scalp and a runner. Because there's a lot of signals with huge risk reward ratios but also some unprofitable signals . Therefore make sure you make the best out of the good signals and apply proper risk management to limit losses with bad signals. Stop loss placement according to market structure.
Multiple Signals in a row can show a high probability of a very strong upcoming move. Monitor your trades and secure partials to make the best out of it.
You can select how many signals it is going to show once trend conditions are met. Please be aware that the longer a trend goes, the higher is the probability of a reversal. Therefore the first few signals after all conditions are met are most likely the most profitable.
By setting the slope of the slow SMMA correctly you can filter out most signals in a ranging market.
█ DISCLAIMER
This is not financial advice. I do everything I can to provide the most accurate buy and sell signals for scalping but past results are no guarantee for future performance.

Inverse Fisher Transform on Williams %RInverse Fisher Transform On Williams %R
Since Williams R indicator produces negative values, I preferred to add 50 instead of subtracting 50.
It produces values between 0.5 and -0.5.
Generates clear buy and sell signals.
Williams %R determines overbought and oversold levels.
You can see more softly.

HPH's FractalTradesThis indicator is based on some dark fractal magic.
Not really, it's inspired by Vladimir Poltoratskiy and basically just waits for the price to go higher or lower than a previous fractal. If that's the case and all the additional settings allow the trade to take place, it is entered with the stop loss at the last opposite fractal of were it was entered (so if we enter a trade because the price went higher than the last up fractal, the sl is at the last down fractal).
The trades are visualised with a stop loss and 3 take profits levels (at a 1:1, 2,1:1 and 4:1 risk/reward ratio). The stop loss will trail once a certain take profit level is reached. Enjoy!
The settings:
LiveVersion : If ticked it will use close for stop losses and take profits. If unticked high and low will be used. Neither is accurate when backtesting as there is no intrabar data...
CancelEarly : Swings trade in the opposite direction when an opposite signal is received. If unticked the trade will continue until a tp or sl is hit.
ShowStats : Show a table in the top right displaying how many times the stop losses or take profits got hit.
FractalPeriods : Number of bars that are required for a fractal. E.g. if it's 2, 2 bars need to be lower on the left and right of a candle for it to print an up fractal.
MinFractalDiv : If this is bigger than 0, it will not allow new fractals to print unless they are at least a percentage based amount bigger than the last one. So this can be used to filter out fractals that are in the same range. Bigger value = more aggressive filtering!
TicksOnFractal : Tick based offset to add onto the fractals to enter trades. E.g. if it's 5 and the price goes above an up fractal, it needs to go up 5 more ticks to enter a trade.
UseFilter, FilterMultMin and FilterMultMax : If ticked, trades are limited to the once in the specified range (distance of the stop loss). E.g. if FilterMultMax is 0.05, the stop loss can not be bigger than 5% of the assets price for the trade to take place.

Alma Moving Average Ribbon Reverse Length [DM]Greetings Colleagues
Following some recommendations and ideas I share this moving average, put all of them together
The length calculation is automatic there is only one input.
The length is inverse so it will wrap from the longest reference point, hence using phi
Moving averages will wrap around the price.
I've also added gradient color to plots and fill plots
There is an alert selector in case you are interested in a particular crossing, "remember that the order is reversed".
There is an alert visual plotshapes with offset signal.
Finally, after spending a few hours with the Williams alligator moving averages I found nothing special, but I added the individual offset adjustment for each moving average in case someone comes up with something.
Enjoy”
Some references about alma by "tradingview pinecoders"
What to look for
The Arnaud Legoux Moving Average has three elements to it:
Window: This element is the period. By default, the window is set to 9 periods, but it can be customized to fit any trading style.
Offset: This element is the Gaussian that is applied to the combo line and can be aligned to the current price. It’s default is set to 0.85, but by setting it to 1, you can make it align fully to the current price (similar to how an Exponential Moving Average (EMA) with a setting of 0 is like a Simple Moving Average (SMA)). 0.85 is what is recommended, however, you can customize it like with the window element.
Sigma: This element is a standard deviation that is applied to the combo line in order for it to appear more sharp. The default is set to 6 and it is not recommended to change the setting. The value of 6 is inspired by the Six Sigma process.
www.tradingview.com
RSI Centered PivotsJust a simple RSI central pivot strategy I made for a friend.
Backtested on BYBIT:BTCUSD, 155m.
DISCLAIMER : Please do your own research into anything you use before using it to trade.

Sam4x 9:45 secretWhat Is the Sam4x 9:45 Secret?
The Sam4x 9:45 secret indicator uses three smoothed moving averages, set at five, eight, and 13 periods, which are all Fibonacci numbers. The initial smoothed average is calculated with a simple moving average (SMA), adding additional smoothed averages that slow down indicator turns.
SUM1 = SUM (CLOSE, N)
SMMA1 = SUM1/N
Subsequent values are:
PREVSUM = SMMA(i-1) *N
SMMA(i) = (PREVSUM-SMMA(i-1)+CLOSE(i))/N
Where:
SUM1 - the sum of closing prices for N periods;
PREVSUM - smoothed sum of the previous bar;
SMMA1 - smoothed moving average of the first bar;
SMMA(i) - smoothed moving average of the current bar (except for the first one);
CLOSE(i) - current closing price;
N - the smoothing period.
How the indicator is calculated is important for understanding the inner workings of the indicator. Luckily, the calculation is not required in practice. The Alligator indicator can be added to your charts from the indicator list in your charting or trading platform.
The three moving averages comprise the Jaw, Teeth, and Lips of the Sam4 9:45 secret opening, and closing in reaction to evolving trends and trading ranges:
Jaw (blue line): Starts with the 13-bar SMMA and is smoothed by eight bars on subsequent values.
Teeth (red line): Starts with the eight-bar SMMA and is smoothed by five bars on subsequent values.
Lips (green line): Starts with the five-bar SMMA and smoothed by three bars on subsequent values.

RoboDCARoboDCA is an indicator I developed to help me accrue Bitcoin at its low point. It won't necessarily be at its lowest point but it's low enough that if you dollar cost average for the long term, the difference is negligible. While using this indicator, I find it also suitable for swing trades in the 4H timeframe every once in a while. Might be the indicator to use if you only do 2-5 trades a month last a few days between trades.
The fundamentals of RoboDCA came from these 2 theories:
Bill Williams Balance Line
Moon Phase
Bill Williams Balance Line
Bill Williams is fantastic, a lot of how I see the chart borrows from his books. For this particular case, his balance line is interesting to me because it's a series of highs and lows that are when broken through inspires a powerful move.
Moon Phase
Every month for as long as the moon and earth have danced in the cosmos, the moons gravity affects the earth physically. Some myth and legends like werewolves even came from this cosmic relationship. For prices though it paints a more honest relationship I would say. It is mostly accurate more than 50% of the time that when the moon's light intensity hits 90% or above, its gravity pulls prices to its lower if not lowest point for about 15 days in the past and 15 days in the future. While a new moon with its light intensity at the lowest would present a local peak.
I wasn't sure about this the first time but charts don't lie, they can't. For dollar cost average purposes, this is one of the best way of not just buying blindly into the market.
RoboDCA
Based on the 2 fundamentals above, I tried to create an indicator to help me see price movements and its direction more honestly. What I can say is this indicator tries to tell you if prices are in a good position to buy.
Numbers have always been interesting for me and while developing this indicator I came across an interesting one, number 528 . The number is supposedly an angelic number that communicates wealth and prosperity, sound like my kind of number. I thought to myself, the simplest prove is to just put the number to a moving average indicator. I opted for EMA to keep it close to prices compared to regular MA and I was pleasantly surprised.
As you can see, the EMA line acts as a perfect support and resistance. Breaking up or down the line would start a powerful move to the direction it was breaking at while touching the line through wicks held as strong support and resistance.
The problem I don't enjoy with moving averages is it's hard to measure zones, you'd need to zoom in into the candles to define the zones manually. I wanted something that would define the zones on screen without my intervention. This brought me back to Bill Williams Balance Line, they have highs and lows. The next step was to put the high/low from the balance line and EMA both lines creating a zone.
The zone created fits perfectly to my needs. Now I can see powerful moves before it happens. When a zone has been tested 2 or 3 times, the chances of prices making powerful moves is humongous. This is a zone that is derived from exponential moving averages of the last 528 high and low balance lines, this in itself is a strong indication for direction.
Let's couple the zone with moon phases like what the chart below illustrates.
In this daily chart, the blue upwards arrow represent an opportunity to buy while the red downward arrows represent an opportunity to sell based on Moon Phases. For dollar cost average, you can see that blue arrows that showed up near to the balance line ribbon represent a perfect buy entry, conviction to buy is as strong as it can be.
Although both Moon Phases and the zone should be enough to know when to buy, it doesn't tell a story of how the upcoming move came to be. Someone told me about another angelic number, this time it's number 247 . Let's how this stack up when put both EMA528 and EMA247 together.
It's a sight to behold.
When prices are moving back and forth between the both EMAs, it's telling you that a powerful move is soon coming. Most traders would also know the meaning of crossovers between a slower MA versus a faster MA or the other way around.
Conclusion
This indicator is written to help me dollar cost average, I hope the explanation above is enough to describe to you how to use the indicator opportunistically. I regret that for this indicator I decided to not share its source code. The logic for this indicator is described above which I'm sure can be a base for anyone to write their own version of it.
Above said, I wish everyone a 528 vibe of wealth and prosperity. Cheers!

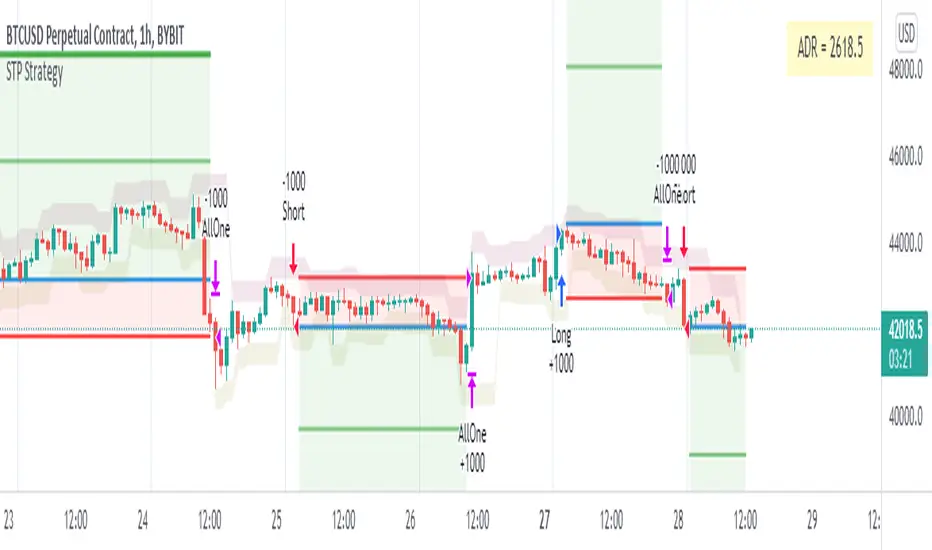
Multi-Market Swing Trader Webhook Ready [HullBuster]
Introduction
This is an all symbol swing trading strategy intended for webhook integration to live accounts. This script employs an adjustable bandwidth ping pong algorithm which can be run in long only, short only or bidirectional modes. Additionally, this script provides advanced features such as pyramiding and DCA. It has been in development for nearly three years and exposes over 90 inputs to accommodate varying risk reward ratios. Equipped with a proper configuration it is suitable for professional traders seeking quality trades from a cloud based platform. This is my most advanced Pine Script to date which combines my RangeV3 and TrendV2 scripts. Using this combination it tries to bridge the gap between range bound and trending markets. I have put a lot of time into creating a system that could transition by itself so as to require less human intervention and thus be able to withstand long periods in full automation mode.
As a Pine strategy, hypothetical performance can be easily back-tested. Allowing you to Iron out the configuration of your target instrument. Now with recent advancements from the Pine development team this same script can be connected to a webhook through the alert mechanism. The requirement of a separate study script has been completely removed. This really makes things a lot easier to get your trading system up and running. I would like to also mention that TradingView has made significant advancements to the back-end over the last year. Notably, compile times are much faster now permitting more complex algorithms to be implemented. Thank you TradingView!
I used QuantConnect as my role model and strived to produce a base script which could compete with higher end cloud based platforms while being attractive to similarly experienced traders. The versatility of the Pine Language combined with the greater selection of end point execution systems provides a powerful alternative to other cloud based platforms. At the very least, with the features available today, a modular trading system for everyday use is a reality. I hope you'll agree.
This is a swing trading strategy so the behavior of this script is to buy on weakness and sell on strength. In trading parlance this is referred to as Support and Resistance Trading. Support being the point at which prices stop falling and start rising. Resistance being the point at which prices stop rising and fall. The chart real estate between these two points being defined as the range. This script seeks to implement strategies to profit from placing trades within this region. Short positions at resistance and long positions at support. Just to be clear, the range as well as trends are merely illusions as the chart only receives prices. However, this script attempts to calculate pivot points from the price stream. Rising pivots are shorts and falling pivots are longs. I refer to pivots as a vertex in this script which adds structural components to the chart formation (point, sides and a base). When trading in “Ping Pong” mode long and short positions are interleaved continuously as long as there exists a detectable vertex.
This is a non-hedging script so those of us subject to NFA FIFO Rule 2-43(b) should be generally safe to webhook into signals emitted from this script. However, as covered later in this document, there are some technical limitations to this statement. I have tested this script on various instruments for over two years and have configurations for forex, crypto and stocks. This script along with my TrendV2 script are my daily trading vehicles as a webhook into my forex and crypto accounts. This script employs various high risk features that could wipe out your account if not used judiciously. You should absolutely not use this script if you are a beginner or looking for a get-rich-quick strategy. Also please see my CFTC RULE 4.41 disclosure statement at the end of the document. Really!
Does this script repaint? The short answer is yes, it does, despite my best efforts to the contrary. EMAs are central to my strategy and TradingView calculates from the beginning of the series so there is just no getting around this. However, Pine is improving everyday and I am hopeful that this issue will be address from an architectural level at some point in the future. I have programmed my webhook to compensate for this occurrence so, in the mean time, this my recommended way to handle it (at the endpoint and before the broker).
Design
This strategy uses a ping pong algorithm of my own design. Basically, trades bounce off each other along the price stream. Trades are produced as a series of reversals. The point at which a trade reverses is a pivot calculation. A measurement is made between the recent valley to peak which results in a standard deviation value. This value is an input to implied probability calculation.Yes, the same implied probability used in sports betting. Odds are then calculated to determine the likelihood of price action continuing or retracing to the pivot. Based on where the account is at alert time, the action could be an entry, take profit or pyramid signal. In this design, trades must occur in alternating sequence. A long followed by a short then another long followed by a short and so on. In range bound price action trades appear along the outer bands of the channel in the aforementioned sequence. Shorts on the top and longs at the bottom. Generally speaking, the widths of the trading bands can be adjusted using the vertex dynamics in Section 2. There are a dozen inputs in this section used to describe the trading range. It is not a simple adjustment. If pyramids are enabled the strategy overrides the ping pong reversal pattern and begins an accumulation sequence. In this case you will see a series of same direction trades.
This script uses twelve indicators on a single time frame. The original trading algorithms are a port from a C++ program on proprietary trading platform. I’ve converted some of the statistical functions to use standard indicators available on TradingView. The setups make heavy use of the Hull Moving Average in conjunction with EMAs that form the Bill Williams Alligator as described in his book “New Trading Dimensions” Chapter 3. Lag between the Hull and the EMAs play a key role in identifying the pivot points. I really like the Hull Moving Average. I use it in all my systems, including 3 other platforms. It’s is an excellent leading indicator and a relatively light calculation.
The trend detection algorithms rely on several factors:
1. Smoothed EMAs in a Willams Alligator pattern.
2. Number of pivots encountered in a particular direction.
3. Which side debt is being incurred.
4. Settings in Section 4 and 5 (long and short)
The strategy uses these factors to determine the probability of prices continuing in the most recent direction. My TrendV2 script uses a higher time frame to determine trend direction. I can’t use that method in this script without exceeding various TradingView limitations on code size. However, the higher time frame is the best way to know which trend is worth pursuing or better to bet against.
The entire script is around 2400 lines of Pine code which pushes the limits of what can be created on this platform given the TradingView maximums for: local scopes, run-time duration and compile time. The module has been through numerous refactoring passes and makes extensive use of ternary statements. As such, It takes a full minute to compile after adding it to a chart. Please wait for the hovering dots to disappear before attempting to bring up the input dialog box. Scrolling the chart quickly may bring up an hour glass.
Regardless of the market conditions: range or trend. The behavior of the script is governed entirely by the 91 inputs. Depending on the settings, bar interval and symbol, you can configure a system to trade in small ranges producing a thousand or more trades. If you prefer wider ranges with fewer trades then the vertex detection settings in Section 2 should employ stiffer values. To make the script more of a trend follower, adjustments are available in Section 4 and 5 (long and short respectively). Overall this script is a range trader and the setups want to get in that way. It cannot be made into a full blown trend trading system. My TrendV2 is equipped for that purpose. Conversely, this script cannot be effectively deployed as a scalper either. The vertex calculation require too much data for high frequency trading. That doesn’t work well for retail customers anyway. The script is designed to function in bar intervals between 5 minutes and 4 hours. However, larger intervals require more backtest data in order to create reliable configurations. TradingView paid plans (Pro) only provide 10K bars which may not be sufficient. Please keep that in mind.
The transition from swing trader to trend follower typically happens after a stop is hit. That means that your account experiences a loss first and usually with a pyramid stack so the loss could be significant. Even then the script continues to alternate trades long and short. The difference is that the strategy tries to be more long on rising prices and more short on falling prices as opposed to simply counter trend trading. Otherwise, a continuous period of rising prices results in a distinctly short pyramid stack. This is much different than my TrendV2 script which stays long on peaks and short on valleys. Basically, the plan is to be profitable in range bound markets and just lose less when a trend comes along. How well this actually plays out will depend largely on the choices made in the sectioned input parameters.
Sections
The input dialog for this script contains 91 inputs separated into six sections.
Section 1: Global settings for the strategy including calculation model, trading direction, exit levels, pyramid and DCA settings. This is where you specify your minimum profit and stop levels. You should setup your Properties tab inputs before working on any of the sections. It’s really important to get the Base Currency right before doing any work on the strategy inputs. It is important to understand that the “Minimum Profit” and “Limit Offset” are conditional exits. To exit at a profit, the specified value must be exceeded during positive price pressure. On the other hand, the “Stop Offset” is a hard limit.
Section 2: Vertex dynamics. The script is equipped with four types of pivot point indicators. Histogram, candle, fractal and transform. Despite how the chart visuals may seem. The chart only receives prices. It’s up to the strategy to interpret patterns from the number stream. The quality of the feed and the symbol’s bar characteristics vary greatly from instrument to instrument. Each indicator uses a fundamentally different pattern recognition algorithm. Use trial and error to determine the best fit for your configuration. After selecting an indicator type, there are eight analog fields that must be configured for that particular indicator. This is the hardest part of the configuration process. The values applied to these fields determine how the range will be measured. They have a big effect on the number of trades your system will generate. To see the vertices click on the “Show Markers” check box in this section. Red markers are long positions and blue markers are short. This will give you an idea of where trades will be placed in natural order.
Section 3: Event thresholds. Price spikes are used to enter and exit trades. The magnitude which define these spikes are configured here. The rise and fall events are primarily for pyramid placement. The rise and fall limits determine the exit threshold for the conditional “Limit Offset” field found in Section 1. These fields should be adjusted one at a time. Use a zero value to disengage every one but the one you are working on. Use the fill colors found in Section 6 to get a visual on the values applied to these fields. To make it harder for pyramids to enter stiffen the Event values. This is more of a hack as the formal pyramid parameters are in Section 1.
Section 4 and 5: Long and short settings. These are mirror opposite settings with all opposing fields having the same meaning. Its really easy to introduce data mining bias into your configuration through these fields. You must combat against this tendency by trying to keep your settings as uniform as possible. Wildly different parameters for long and short means you have probably fitted the chart. There are nine analog and thirteen Boolean fields per trade direction. This section is all about how the trades themselves will be placed along the range defined in Section 2. Generally speaking, more restrictive settings will result in less trades but higher quality. Remember that this strategy will enter long on falling prices and short on rising prices. So getting in the trade too early leads to a draw-down. However, this could be what you want if pyramiding is enabled. I, personally, have found that the best configurations come from slightly skewing one side. I just accept that the other side will be sub-par.
Section 6: Chart rendering. This section contains one analog and four Boolean fields. More or less a diagnostic tool. Of particular interest is the “Symbol Debt Sequence” field. This field contains a whole number which paints regions that have sustained a run of bad trades equal or greater than specified value. It is useful when DCA is enabled. In this script Dollar Cost Averaging on new positions continues only until the symbol debt is recouped. To get a better understanding on how this works put a number in this field and activate DCA. You should notice how the trade size increases in the colored regions. The “Summary Report” checkbox displays a blue information box at the live end of the chart. It exposes several metrics which you may find useful if manually trading this strategy from audible alerts or text messages.
Pyramids
This script features a downward pyramiding strategy which increases your position size on losing trades. On purely margin trades, this feature can be used to, hypothetically, increase the profit factor of positions (not individual trades). On long only markets, such as crypto, you can use this feature to accumulate coins at depressed prices. The way it works is the stop offset, applied in the Section 1 inputs, determines the maximum risk you intend to bear. Additional trades will be placed at pivot points calculated all the way down to the stop price. The size of each add on trade is increased by a multiple of its interval. The maximum number of intervals is limited by the “Pyramiding” field in the properties tab. The rate at which pyramid positions are created can be adjusted in Section 1. To see the pyramids click on the “Mark Pyramid Levels” check box in the same section. Blue triangles are painted below trades other than the primary.
Unlike traditional Martingale strategies, the result of your trade is not dependent on the profit or loss from the last trade. The position must recover the R1 point in order to close. Alternatively, you can set a “Pyramid Bale Out Offset” in Section 1 which will terminate the trade early. However, the bale out must coincide with a pivot point and result in a profitable exit in order to actually close the trade. Should the market price exceed the stop offset set in Section 1, the full value of the position, multiplied by the accepted leverage, will be realized as a loss to the trading account. A series of such losses will certainly wipe out your account.
Pyramiding is an advanced feature intended for professional traders with well funded accounts and an appropriate mindset. The availability of this feature is not intended to endorse or promote my use of it. Use at your own risk (peril).
DCA
In addition to pyramiding this script employs DCA which enables users to experiment with loss recovery techniques. This is another advanced feature which can increase the order size on new trades in response to stopped out or winning streak trades. The script keeps track of debt incurred from losing trades. When the debt is recovered the order size returns to the base amount specified in the properties tab. The inputs for this feature are found in section 3 and include a limiter to prevent your account from depleting capital during runaway markets. The main difference between DCA and pyramids is that this implementation of DCA applies to new trades while pyramids affect open positions. DCA is a popular feature in crypto trading but can leave you with large “bags” if your not careful. In other markets, especially margin trading, you’ll need a well funded account and much experience.
To be sure pyramiding and dollar cost averaging is as close to gambling as you can get in respectable trading exchanges. However, if you are looking to compete in a spot trading contest or just want to add excitement to your trading life style those features could find a place in your strategies. Although your backtest may show spectacular gains don’t expect your live trading account to do the same. Every backtest has some measure of data mining bias. Please remember that.
Webhook Integration
The TradingView alerts dialog provides a way to connect your script to an external system which could actually execute your trade. This is a fantastic feature that enables you to separate the data feed and technical analysis from the execution and reporting systems. Using this feature it is possible to create a fully automated trading system entirely on the cloud. Of course, there is some work to get it all going in a reliable fashion. To that end this script has several things going for it. First off, it is a strategy type script. That means that the strategy place holders such as {{strategy.position_size}} can be embedded in the alert message text. There are more than 10 variables which can write internal script values into the message for delivery to the specified endpoint. Additionally, my scripts output the current win streak and debt loss counts in the {{strategy.order.alert_message}} field. Depending on the condition, this script will output other useful values in the JSON “comment” field of the alert message. Here is an excerpt of the fields I use in my webhook signal:
"broker_id": "kraken",
"account_id": "XXX XXXX XXXX XXXX",
"symbol_id": "XMRUSD",
"action": "{{strategy.order.action}}",
"strategy": "{{strategy.order.id}}",
"lots": "{{strategy.order.contracts}}",
"price": "{{strategy.order.price}}",
"comment": "{{strategy.order.alert_message}}",
"timestamp": "{{time}}"
Though TradingView does a great job in dispatching your alert this feature does come with a few idiosyncrasies. Namely, a single transaction call in your script may cause multiple transmissions to the endpoint. If you are using placeholders each message describes part of the transaction sequence. A good example is closing a pyramid stack. Although the script makes a single strategy.close() call, the endpoint actually receives a close message for each pyramid trade. The broker, on the other hand, only requires a single close. The incongruity of this situation is exacerbated by the possibility of messages being received out of sequence. Depending on the type of order designated in the message, a close or a reversal. This could have a disastrous effect on your live account. This broker simulator has no idea what is actually going on at your real account. Its just doing the job of running the simulation and sending out the computed results. If your TradingView simulation falls out of alignment with the actual trading account lots of really bad things could happen. Like your script thinks your are currently long but the account is actually short. Reversals from this point forward will always be wrong with no one the wiser. Human intervention will be required to restore congruence. But how does anyone find out this is occurring? In closed systems engineering this is known as entropy. In practice your webhook logic should be robust enough to detect these conditions. Be generous with the placeholder usage and give the webhook code plenty of information to compare states. Both issuer and receiver. Don’t blindly commit incoming signals without verifying system integrity.
Operation
This is a swing trading strategy so the fundamental behavior of this script is to buy on weakness and sell on strength. As such trade orders are placed in a counter direction to price pressure. What you will see on the chart is a short position on peaks and a long position on valleys. This is slightly misleading since a range as well as a trend are best recognized, in hindsight, after the patterns occur on the chart. In the middle of a trade, one never knows how deep valleys will drop or how high peaks will rise. For certain, long trades will continue to trigger as the market prices fall and short trades on rising prices. This means that the maximum efficiency of this strategy is achieved in choppy markets where the price doesn’t extend very far from its adjacent pivot point. Conversely, this strategy will be the least efficient when market conditions exhibit long continuous single direction price pressure. Especially, when measured in weeks. Translation, the trend is not your friend with this strategy. Internally, the script attempts to recognize prolonged price pressure and changes tactics accordingly. However, at best, the goal is to weather the trend until the range bound market returns. At worst, trend detection fails and pyramid trades continue to be placed until the limit specified in the Properties tab is reached. In all likelihood this could trigger a margin call and if it hits the stop it could wipe out your account.
This script has been in beta test four times since inception. During all that time no one has been successful in creating a configuration from scratch. Most people give up after an hour or so. To be perfectly honest, the configuration process is a bear. I know that but there is no way, currently, to create libraries in Pine. There is also no way specify input parameters other than the flattened out 2-D inputs dialog. And the publish rules clearly state that script variations addressing markets or symbols (suites) are not permitted. I suppose the problem is systemic to be-all-end-all solutions like my script is trying to be. I needed a cloud strategy for all the symbols that I trade and since Pine does not support library modules, include files or inter process communication this script and its unruly inputs are my weapon of choice in the war against the market forces. It takes me about six hours to configure a new symbol. Also not all the symbols I configure are equally successful. I should mention that I have a facsimile of this strategy written in another platform which allows me to run a backtest on 10 years of historical data. The results provide me a sanity check on the inputs I select on this platform.
My personal configurations use a 10 minute bar interval on forex instruments and 15 minutes on crypto. I try to align my TradingView scripts to employ standard intervals available from the broker so that I can backtest longer durations than those available on TradingView. For example, Bitcoin at 15 minute bars is downloadable from several sources. I really like the 10 minute bar. It provides lots of detectable patterns and is easy to store many years in an SQL database.
The following steps provide a very brief set of instructions that will get you started but will most certainly not produce the best backtest. A trading system that you are willing to risk your hard earned capital will require a well crafted configuration that involves time, expertise and clearly defined goals. As previously mentioned, I have several example configurations that I use for my own trading that I can share with you if you like. To get hands on experience in setting up your own symbol from scratch please follow the steps below.
Step 1. Setup the Base currency and order size in the properties tab.
Step 2. Select the calculation presets in the Instrument Type field.
Step 3. Select “No Trade” in the Trading Mode field
Step 4. Select the Histogram indicator from Section 2. You will be experimenting with different ones so it doesn’t matter which one you try first.
Step 5. Turn on Show Markers in Section 2.
Step 6. Go to the chart and checkout where the markers show up. Blue is up and red is down. Long trades show up along the red markers and short trades on the blue.
Step 7. Make adjustments to “Base To Vertex” and “Vertex To Base” net change and ROC in Section 2. Use these fields to move the markers to where you want trades to be.
Step 8. Try a different indicator from Section 2 and repeat Step 7 until you find the best match for this instrument on this interval. This step is complete when the Vertex settings and indicator combination produce the most favorable results.
Step 9. Go to Section 4 and enable “Apply Red Base To Base Margin”.
Step 10. Go to Section 5 and enable “Apply Blue Base To Base Margin”.
Step 11. Go to Section 2 and adjust “Minimum Base To Base Blue” and “Minimum Base To Base Red”. Observe the chart and note where the markers move relative to each other. Markers further apart will produce less trades but will reduce cutoffs in “Ping Pong” mode.
Step 12. Turn off Show Markers in Section 2.
Step 13. Put in your Minimum Profit and Stop Loss in the first section. This is in pips or currency basis points (chart right side scale). Percentage is not currently supported. Note that the profit is taken as a conditional exit on a market order not a fixed limit. The actual profit taken will almost always be greater than the amount specified. The stop loss, on the other hand, is indeed a hard number which is executed by the TradingView broker simulator when the threshold is breached.
Step 14. Return to step 3 and select a Trading Mode (Long, Short, BiDir, Ping Pong). If you are planning to trade bidirectionally its best to configure long first then short. Combine them with “BiDir” or “Ping Pong” after setting up both sides of the trade individually. The difference between “BiDir” and “Ping Pong” is that “Ping Pong” uses position reversal and can cut off opposing trades less than the specified minimum profit. As a result “Ping Pong” mode produces the greatest number of trades.
Step 15. Take a look at the chart. Trades should be showing along the markers plotted earlier.
Step 16. Make adjustments to the Vertex fields in Section 2 until the TradingView performance report is showing a profit. This includes the “Minimum Base To Base” fields. If a profit cannot be achieved move on to Step 17.
Step 17. Improve the backtest profitability by adjusting the “Entry Net Change” and “Entry ROC” in Section 4 and 5.
Step 18. Enable the “Mandatory Snap” checkbox in Section 4 and 5 and adjust the “Snap Candle Delta” and “Snap Fractal Delta” in Section 2. This should reduce some chop producing unprofitable reversals.
Step 19. Increase the distance between opposing trades by adding an “Interleave Delta” in Sections 4 and 5. This is a floating point value which starts at 0.01 and typically does not exceed 2.0.
Step 20. Increase the distance between opposing trades even further by adding a “Decay Minimum Span” in Sections 4 and 5. This is an absolute value specified in the symbol’s quote currency (right side scale of the chart). This value is similar to the minimum profit and stop loss fields in Section 1.
Step 21. The “Buy Composite Strength” input works in tandem with “Long Decay Minimum Span” in Section 4. Try enabling and see if it improves the performance. This field is only relevant when there is a value in “Long Decay Minimum Span”.
Step 22. The “Sell Composite Weakness” input works in tandem with “Short Decay Minimum Span” in Section 5. Try enabling and see if it improves the performance. This field is only relevant when there is a value in “Short Decay Minimum Span”.
Step 23. Improve the backtest profitability by adjusting the “Adherence Delta” in Section 4 and 5. This field requires the “Adhere to Rising Trend” checkbox to be enabled.
Step 24. At this point your strategy should be more or less working. Experiment with the remaining check boxes in Section 4 and 5. Keep the ones which seem to improve the performance.
Step 25. Examine the chart and see that trades are being placed in accordance with your desired trading goals. This is an important step. If your desired model requires multiple trades per day then you should be seeing hundreds of trades on the chart. Alternatively, you may be looking to trade fewer steep peaks and deep valleys in which case you should see trades at major turning points. Don’t simply settle for what the backtest serves you. Work your configuration until the system aligns with your desired model. Try changing indicators and even intervals if you cannot reach your simulation goals. Generally speaking, the histogram and Candle indicators produce the most trades. The Fractal indicator captures the tallest peaks and valleys. The Transform indicator is the most reliable but doesn’t well work on all instruments.
Example Settings
To reproduce the performance shown on the chart please use the following configuration:
1. Select XBTUSD Kraken as the chart symbol.
2. On the properties tab set the Order Size to: 0.01 Bitcoin
3. On the properties tab set the Pyramiding to: 10
4. In Section 1: Select “Forex” for the Instrument Type
5. In Section 1: Select “Ping Pong” for the Trading Mode
6. In Section 1: Input 1200 for the Minimum Profit
7. In Section 1: Input 15000 for the Stop Offset
8. In Section 1: Input 1200 for the Pyramid Minimum Span
9. In Section 1: Check mark the Ultra Wide Pyramids
10. In Section 2: Check mark the Use Transform Indicator
So to be clear, I used a base position size of one - one hundredth of a Bitcoin and allow the script to add up to 10 downward pyramids. The example back-test did hit eight downward pyramids. That means the account would have to be able to withstand a base position size (0.01) times 28. The resulting position size is 0.28 of a Bitcoin. If the price of Bitcoin is 35K then the draw down amount (not including broker fees) would be $9800 dollars. Since I have a premium subscription my backtest chart includes 20K historical bars. That's roughly six months of data. As of today, pro accounts only get 10K bars so the performance cannot be exactly matched with such a difference in historical data. Please keep that in mind.
There are, of course, various ways to reduce the risk incurred from accumulating pyramids. You can increase the “Pyramid Minimum Span” input found in Section 2 which increases the space between each pyramid trade. Also you can set a “Pyramid Bale Out Offset” in the same input section. This lets you out of the trade faster on position recovery. For example: Set a value of 8000 into this input and the number of trades increase to 178 from 157. Since the positions didn’t go full term, more trades were created at less profit each. The total brute force approach would be to simply limit the number of pyramids in the Properties tab.
It should be noted that since this is crypto, accumulating on the long side may be what you want. If you are not trading on margin and thus outright buying coins on the Kraken exchange you likely are interested in increasing your Bitcoin position at depressed prices. This is a popular feature on some of the other crypto trading packages like CryptoHopper and Profit Trailer. Click on Enable TV Long Only Rule in Section 1. This switches the signal emitter to long only. However, you may still see short trades on the chart. They are treated as a close instead of a reversal.
Feel free to PM me with any questions related to this script. Thank you and happy trading!
CFTC RULE 4.41
These results are based on simulated or hypothetical performance results that have certain inherent limitations. Unlike the results shown in an actual performance record, these results do not represent actual trading. Also, because these trades have not actually been executed, these results may have under-or over-compensated for the impact, if any, of certain market factors, such as lack of liquidity. Simulated or hypothetical trading programs in general are also subject to the fact that they are designed with the benefit of hindsight. No representation is being made that any account will or is likely to achieve profits or losses similar to these being shown.
