Fear Greed Zones by Relative Strength IndexThis is a visual modification of the relative Strength Index (RSI) to express extreme areas as fear and greed Zones.
// Input
rsiLength = input.int(14, "RSI Length", minval=1)
// RSI calculation
rsi = ta.rsi(close, rsiLength)
FEAR GREED ZONES
The "Fear Greed Zones Script" indicator is designed to help traders identify psychological levels of fear and greed in the market by utilising relative strength index. It primarily utilises the Relative Strength Index of price to gauge market sentiment, with the following key features:
Color-Codes
Dark Red: Indicates a greed zone , suggesting extreme overbought conditions (high risk) and a possible price reversal downward.
Dark Green: Represents a fear zone, indicating extreme oversold conditions (low risk) and potential for price reversal upward.
Yellow: Serves as a neutral zone with medium risk.
Usage
Market Sentiment Analysis: Traders can use the fear and greed zones to assess overall market sentiment, aligning their strategies with prevailing emotional biases. This helps in identifying potential entry and exit points based on market psychology.
Risk Management: Understanding fear or greed influences market behavior and allows traders to manage their risk more effectively with the knowledge of high or low risk areas; as they can anticipate potential reversals or continuations in price trends.
Conclusion
The "Fear Greed Zones" Script is a valuable tool for traders looking to leverage market psychology. By clearly identifying areas where fear or greed may be influencing price movements, it aids in making more informed trading decisions.
빌 윌리엄스 인디케이터

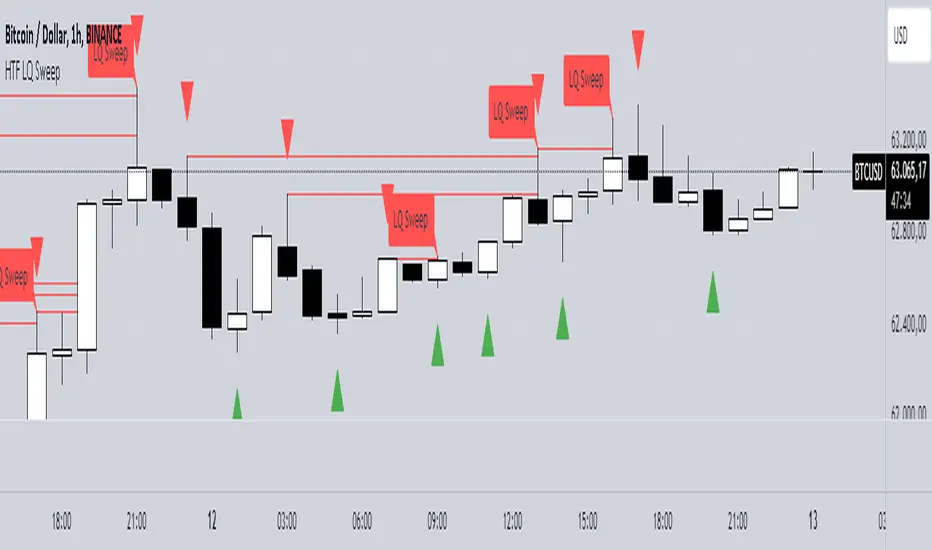
HTF LQ SweepThe following script recognises QL sweeps in the desired time frame with alarm function!
Theory:
There is liquidity above highs and below lows. If this is tapped and the market reacts strongly immediately, the probability of a reversal is greatly increased! In the chart, this is defined in such a way that a candle has its wicks BELOW the old low, but the close is ABOVE the old low. the same applies to the high, of course!
In such a case we have an "LQ Sweep"
How does the script work?
Williams 3 fractals are used as a basis. These are meaningful as lows or highs. Whenever a fractal is created, the price level is saved.
This means that not only the last fractal is relevant, but all historical fractals as long as they have not been reached!
If a candle reaches the level, but shows a rejection and closes within the level again, we have our "LQ Sweep" setup.
In the script you can select the timeframe in which the market has to be analysed. When the QL sweep occurs, an alert is triggered. This saves a lot of time because you can analyse different markets in different timeframes at the same time!
Each QL Sweep is marked in the chart when we are in the selected timeframe. These can also be deactivated so that only the last sweep is displayed.
Benefits for the trader:
An LQ sweep is a nice confirmation for a reversal.
If we have such an LQ sweep, we can wait in the lower timeframe for further confirmation, such as a structural break, to position our entries there.
The alarm function saves us a lot of time and we only go to the chart when a potential setup has been created.
You can set different time frames in the script: The selected time frame is then scanned and sends a signal when the event occurs.
Divergence Indicator Multi [TradingFinder] MACD AO RSI DIV Chart🔵 Introduction
🟣 What is Divergence in Financial Markets?
Divergence in technical analysis happens when the price of a stock moves in a direction opposite to certain indicators. This is a crucial concept in financial markets as it can signal either a trend reversal or a continuation of the current correction in the trend. Understanding divergence helps traders and analysts make more informed decisions.
🟣 Positive Regular Divergence (RD+)
A positive regular divergence occurs at the end of a downtrend, where two price lows form. This divergence appears when the price chart shows a new low, but the indicator does not follow, signaling potential buying opportunities.
Positive divergence indicates increased buying pressure and reduced selling pressure, making it a useful signal for forecasting price increases.
🟣 Negative Regular Divergence (RD-)
A negative regular divergence is seen during an uptrend when two price highs form. The price chart records a new high, but the indicator does not reflect this change, suggesting that a market downturn is likely.
This type of divergence shows strong selling pressure and weaker buying activity, which can help identify selling opportunities.
Both positive and negative divergences are powerful tools for identifying potential trend reversals and key support and resistance levels. For example, when an indicator trends upward while the price moves downward, this creates divergence, warning traders to reconsider their investment strategy.
🟣 Different Types of Divergence in Trading
1. Regular Divergence :
o Positive Regular Divergence (RD+)
o Negative Regular Divergence (RD-)
2. Hidden Divergence :
o Positive Hidden Divergence (HD+)
o Negative Hidden Divergence (HD-)
3.Time Divergence.
Note : This guide focuses specifically on Regular Divergence.
🟣 What is Regular Divergence?
Regular Divergence, often referred to as convergence, occurs when price action and indicators show conflicting patterns, usually signaling the end of a trend. Detecting regular divergence helps traders anticipate potential trend reversals or the formation of reversal patterns.
🔵 How to Use
To optimize the detection of divergence, you can adjust the Fractal Period to specify the length of time for identifying divergence patterns.
Additionally, with the Divergence Detection Method, you can select oscillators like the MACD, RSI, or AO to base divergence detection on.
Divergence in MACD :
MACD divergence occurs when the price chart forms an opposite pattern compared to the MACD line, indicating a potential price reversal.
Divergence in RSI :
In a downtrend, if the price chart forms two consecutive lows with the second lower than the first, but the RSI shows two lows with the second higher, this indicates positive regular divergence, which is a buy signal.
On the other hand, during an uptrend, if the price forms two highs with the second higher than the first, but the RSI shows the second high lower, this points to negative regular divergence, indicating a sell signal.
Divergence in AO (Awesome Oscillator) :
The AO indicator calculates histograms using the difference between 5-period and 34-period simple moving averages. It compares peaks and troughs of these histograms with price movements, detecting divergence and plotting lines and arrows to signal divergence.
🔵 Table
The following table breaks down the main features of the oscillator. It covers four critical categories: Exist, Consecutive, Divergence Quality, and Change Phase Indicator.
Exist : If divergence is detected, a "+" will appear in this row.
Consecutive: Shows the number of consecutive divergences that have formed in a short period.
Divergence Quality : Evaluates the quality of the divergence based on the number of occurrences. One is labeled "Normal," two are "Good," and three or more are considered "Strong."
Change Phase Indicator : If a phase change is detected between two oscillation peaks, this is marked in the table.

Larry Williams Valuation Index [tradeviZion]Larry Williams Valuation Index
Welcome to the Larry Williams Valuation Index by tradeviZion! This script is an interpretation of Larry Williams' famous WillVal (Valuation) Index, originally developed in 1990 to help traders determine whether a market or asset is overvalued or undervalued. We've extended it to support multiple securities and offer alerts for different valuation levels, helping you make more informed trading decisions.
What is the Valuation Index?
The Valuation Index measures how a security's current price compares to its historical price action. It helps identify whether the security is overvalued (priced too high), undervalued (priced too low), or in a normal range.
This version supports multiple securities and uses valuation parameters to help you assess the relative valuation of three securities simultaneously. It can help you determine the best times to enter (buy) or exit (sell) the market.
Key Features
Multi-Security Analysis: Analyze up to three securities simultaneously to get a broader view of market conditions.
Valuation Levels: Automatically calculate overvaluation and undervaluation levels or set manual levels for consistent analysis.
Custom Alerts: Create custom alerts when securities move between overvalued, undervalued, or normal ranges.
Customizable Table Display: Display a table with valuation values and their status on the chart.
Getting Started
Step 1: Adding the Script to Your Chart
First, add the Larry Williams Valuation Index script to your chart on TradingView. The script is designed to work with any timeframe, but for best results, use weekly or daily timeframes for a longer-term perspective.
Step 2: Configuring Securities
The script allows you to analyze up to three different securities :
Security 1 (Default: DXY)
Security 2 (Default: GC1!)
Security 3 (Default: ZB1!)
You can enable or disable each security individually.
Custom Timeframe Option: You have the option to select a custom timeframe for analysis. This allows you to see whether the security is overvalued or undervalued in lower or higher timeframes. Note that this feature is experimental and has not been extensively tested. Larry Williams originally used the weekly timeframe to determine if a stock was overvalued or undervalued. By default, the indicator compares the current price with the security based on the selected timeframe, except if you choose to use a custom timeframe.
Pro Tip : New users can start with the default securities to understand the concept before using other assets.
Step 3: Valuation Index Settings
Short EMA Length : This is the short-term average used for calculations. A lower value makes it more responsive to recent price changes.
Long EMA Length : This is the long-term average, used to smooth the valuation over time.
Valuation Length (Default: 156) : Represents approximately three years of daily bars (as recommended by Larry Williams).
How is the Valuation Index Calculated?
The valuation calculation is done using a method called WVI (WillVal Index), which compares the current price of a security to the price of another correlated security. Here’s a step-by-step explanation:
1. Data Collection: The script takes the closing price of the security you are analyzing and the closing price of the correlated security.
2. Ratio Calculation : The ratio of the two prices is calculated:
Price Ratio = (Price of your security) / (Price of correlated security) * 100.
This ratio helps determine how expensive or cheap your security is compared to the correlated one.
3. Exponential Moving Averages (EMAs) : The price ratio is used to calculate short-term and long-term EMAs (Exponential Moving Averages). EMAs are used to create smooth lines that represent the average price of a security over a specific period of time, with more weight given to recent data. By calculating both short-term and long-term EMAs, we can identify the trend direction and how the security is performing compared to its historical averages.
4. Valuation Index Calculation:
The Valuation Index is calculated as the difference between the short-term EMA and the long-term EMA. This difference helps to determine if the security is currently overvalued or undervalued:
A positive value indicates that the price is above its longer-term trend, suggesting potential overvaluation.
A negative value indicates that the price is below its longer-term trend, suggesting potential undervaluation.
5. Normalization:
To make the valuation easier to interpret, the calculated valuation index is then normalized using the highest and lowest values over the selected valuation length (e.g., 156 bars).
This normalization process converts the index into a percentage between 0 and 100, where higher values indicate overvaluation and lower values indicate undervaluation.
Step 4: Understanding Valuation Levels
The valuation levels indicate whether a security is currently undervalued, overvalued, or in a normal range.
Manual Levels : You can manually set the overvaluation and undervaluation thresholds (default is 85 for overvalued and 15 for undervalued).
Auto Levels : The script can automatically calculate these levels based on recent price action, allowing you to adapt to changing market conditions.
Auto Levels Calculation Explained:
The Auto Levels are calculated by taking the average of the valuation indices for all three securities (e.g., index1, index2, and index3).
The script then looks at the highest and lowest values of this average over a selected number of recent bars (e.g., 50 bars).
The overvaluation level is determined by taking the highest value and multiplying it by a multiplier (e.g., 5). Similarly, the undervaluation level is calculated using the lowest value and the multiplier.
These dynamic levels adjust according to recent price action, providing an adaptive approach to identifying overvalued and undervalued conditions.
Step 5: How to Use the Script to Make Trading Decisions
For new users, here's a step-by-step trading strategy you can use with the Valuation Index:
1. Identify Undervalued Opportunities
When two or more securities are in the undervalued range (below 15 for manual or below automatically calculated undervalue levels), wait for at least two of these securities to turn from undervalued to normal .
This transition indicates a potential buy opportunity .
2. Buying Signal
When at least two securities transition from undervalued to normal, you can consider buying the asset.
This indicates that the market may be recovering from undervalued conditions and could be moving into a growth phase.
3. Selling Signal
Exit when the price high closes below the EMA 21 (21-day exponential moving average).
Alternatively, if the valuation index reaches overvalued levels (above 85 manually or auto-calculated), wait for it to drop back to normal . This can be another point to exit the trade .
You can also use any other sell condition based on your r isk management strategy .
Alerts for Valuation Levels
The script includes alerts to notify you of changing market conditions:
To activate these alerts, follow these steps, referring to the provided screenshot with detailed steps:
1. Enable Alerts : Click on the settings gear icon on the script title in your chart. In the settings menu, scroll to the section labeled Alerts Settings .
Enable Alerts by checking the Enable Alerts box.
Set the Required Securities for Alert (default is 2 securities).
Choose the Alert Frequency : Selecting Once Per Bar Close will trigger alerts only at the close of each bar, ensuring you receive confirmed signals rather than potentially noisy intermediate signals.
2. Select Alert Type : Choose the type of alert you want to activate, such as Alert on Overvalued, Alert on Undervalued, Alert on Over to Normal , or Alert on Under to Normal .
3. Save Settings : Click OK to save your alert settings.
4. Add Alert on Indicator : Click the "..." (More button) next to the indicator name on the chart and select " Add alert on tradeviZion - WillVal ".
5. Create Alert : In the Create Alert window:
Set Condition to tradeviZion - WillVal .
Ensure Any alert() function call is selected.
Set the Alert Name and select your Expiration preferences.
6. Set Notification Preferences : Go to the Notifications tab and select how you want to receive notifications, such as via app notification, toast notification, email , or sound alert . Adjust these preferences to best suit your needs.
7. Click Create : Finally, click Create to activate the alert.
These alerts will help you stay informed about key market conditions and take action accordingly, ensuring you do not miss critical trading opportunities.
Understanding the Table Display
The script includes an interactive table on the chart to show the valuation status of each security:
Security : The name of the security being analyzed.
Value : The current valuation index value.
Status : Indicates whether the security is overvalued, undervalued , or in a normal range.
Color: Displays a color code for easy identification of status:
Red for overvalued.
Green for undervalued.
Other colors represent normal valuation levels.
Empowering Messages : Motivational messages are displayed to encourage disciplined trading. These messages will change periodically, helping keep a positive trading mindset.
Acknowledgment
This tool builds upon the foundational work of Larry Williams, who developed the WillVal (Valuation) Index concept. It also incorporates enhancements to extend multi-security analysis, valuation normalization, and advanced alerting features, providing a more versatile and powerful indicator. The Larry Williams Valuation Index [ tradeviZion ] helps traders make informed decisions by assessing overvalued and undervalued conditions for multiple securities simultaneously.
Note : Always practice proper risk management and thoroughly test the indicator to ensure it aligns with your trading strategy. Past performance is not indicative of future results.
Trade smarter with TradeVizion—unlock your trading potential today!

---Advanced Harmonic Pattern Scanner v5Summary of the Script:
All Patterns Covered: The script includes all major harmonic patterns: Butterfly, Gartley, Crab, Bat, Cypher, and Three Drives. Both bullish and bearish versions are detected.
ZigZag Swings: The zigzag logic helps find swing points (X, A, B, C, D) which are essential for forming these patterns. You can adjust the zigzagDepth parameter to fine-tune how sensitive the pattern detection is to price swings.
Fibonacci Levels: Each pattern uses specific Fibonacci retracement or extension levels to identify potential patterns, and the script compares price movements to these ratios.
Visual Aid: It uses plotshape() to display detected patterns on the chart and optional line.new() functions to connect the swing points for a better visual representation of the patterns.
How to Customize:
Timeframe: You can run this script on different timeframes by changing the chart on TradingView (1 min, 1 hour, 1 day, etc.).
ZigZag Sensitivity: Adjust the zigzagDepth to refine how frequently swing points are detected. Larger numbers will reduce sensitivity and show fewer but more pronounced patterns.
Pattern Refinement: Modify Fibonacci levels to experiment with custom harmonic patterns or adjust thresholds for the existing ones.
This code is an advanced version and scans the market comprehensively for all major harmonic patterns. Let me know if you need further modifications or explanations!

Multiple ATR Lines with Current Price PercentageThis indicator plots multiple lines based on the Average True Range (ATR) on the chart, helping traders identify potential support and resistance levels. Specifically, it draws three lines above the price and three lines below the price at different multiples of the ATR. Additionally, it plots a dynamic line at the current price level, which shows how much percentage of the ATR the current price has traveled from a specific point.
How it works:
ATR-Based Lines: The indicator calculates three upper and three lower levels based on the ATR of the selected period. These levels represent 1x, 2x, and 3x ATR above and below the current price.
Current Price Line: A dotted line follows the current price, displaying the percentage of the ATR that the price has moved.
Labels: Each line is labeled with its respective ATR multiple (1x ATR, 2x ATR, 3x ATR), and the current price line shows the percentage of the ATR traveled.
Use Cases:
Identifying Market Volatility: Traders can use this indicator to see how far the price has moved relative to its average volatility.
Support and Resistance Levels: The ATR lines can be treated as potential support and resistance zones, providing insight into price targets or stop-loss placement.
Dynamic Tracking: The percentage of ATR traveled helps traders understand the market momentum relative to its historical volatility.
Settings:
ATR Length: The user can adjust the length of the ATR calculation period.
ATR Multiplier: A multiplier to adjust the distance of the lines relative to the ATR.
Advantages:
Clear visualization of market volatility through ATR-based levels.
Real-time tracking of the price’s movement relative to ATR, giving traders a better understanding of price action.
Customizable settings for different trading styles.

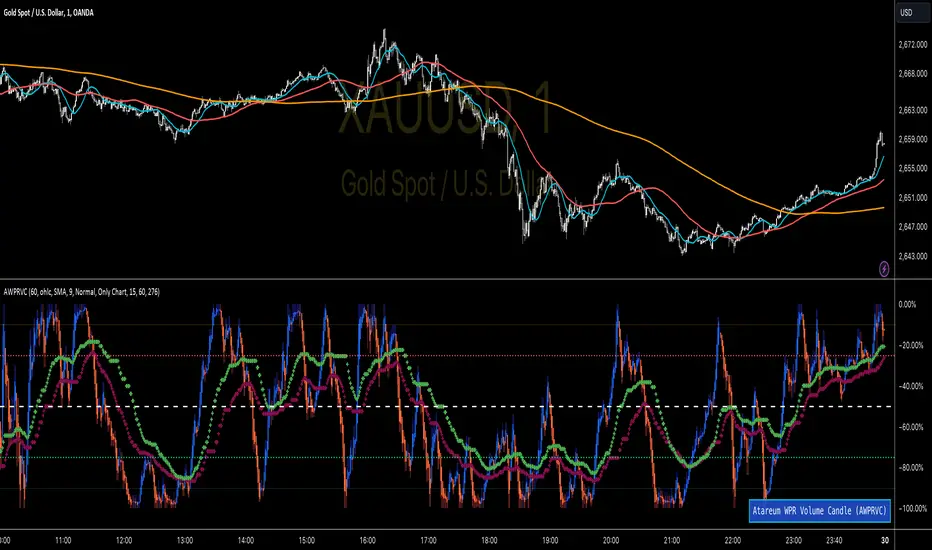
WPR Volume Candle [Atareum]AWPRVC (Atareum WPR Volume Candles) is clearly an awesome indicator produced by AtareumFX that is based on William’s Percent Range concepts by combination with volume. This is a new approach of volume candles that is combined with R% concepts and creates such a powerful tool to trace the market and assists traders to make better decisions surly and so much accurate. You can find this new indicator more useful because it has all benefits and advantages of William’s R% and cover its disadvantages. Also it is more powerful because of using volume in its calculations and generate a new candles which is more reliable and trustworthy.
Concept:
Using William’s Percent leading periods and calculations on redesigning new candles in combination with volume, that makes unique reform candles, but these new candles with their new cloud system clearly response to any reasonable price movement with so much information.
As you know if use R% there are some misleading fake signals generate by oscillator, also it could not show any sign of price moving trend which is almost confusing for beginners or even a pro trader! And finally this oscillator is so sensitive to price change that is so creepy to use for most of traders.
This new AWPRVC solve the problem and make all of them handy and useful for you.
The cloud system which is designed in AWPRVC shows the price trend moving from Bearish Zone (-100 to -50 percent) to Bullish Zone (-50 to 0 percent). You can trust the lead moving forward of the clouds in two separate Top and Bottom (Bull and Bear) lines which solely determine the trend and power of price moving. When clouds are close to each other means we continue the trend and when they get far away from each other means we will face powerful trend in near future. If they are in Bearish Zone we continue the selling pressure and vice versa. Following picture shows good sample of Long and Short positions in compare with so many fake signals generated on original R%.
Besides the cloud system of AWPRVC which is clearly show the price trend and it is completely enough for being sure about price moving trend, you can use moving average which is designated in it to confirm the price trend, also.
Also you can see this new AWPRVC candle by using volume within its conformation, make reasonable price candles which is no so sensitive and so creepy and make your decisions come true in peace and clear sense of market moves. You can see following picture which is showing although the real price candles are so unclear and nonsense of making decision but the AWPRVC candles lead you to make true and trustable position.
As you see this new combination of Williams R% oscillator with volume and also generating a perfect new cloud system will clearly help traders even pro to trust the signals and understand whole market movement better and all of original problems of R% solved and even make a most powerful, trustworthy and useful new indicator.
Parameters:
Section 1 : Candle colour setting for flourishing just as you desire !
Section 2 : Defining Periods of R% and source of candle data in combination with determining the smoothing type of moving averages and signal period.
Section 3 : Select using Standard candles alongside with redesigned cloud calculation type and three additional moving averages which can plot on each newly generated candles and standard candles on a chart with the type mode defined in the previous section.
Note: if you want to omit any or all of these moving averages, you can use 0 in period, instead of selecting "None" in the plot moving option!
Usage :
Overall:
Regardless of the additional moving averages which will lead to so many situations of market according to their types and designs, that is four different period for new redesign AWPRVC and three period for standard chart. You can easily select periods and type for these moving averages. Also, do not forget that signal moving averages is shown only on AWPRVC chart and have two different colour for upward and downward trends. Other moving averages are plot by just one single colour.
Cloud levels are so important because AWPRVC candles show respect to them and when they break the clouds upward or downward it is surly beginning of a trend. Do not forget we have 5 levels for tracing new AWPRVC candles move as follows : Ready for Short \ Long, Surly Short \ Long and Turn Trend which is in middle range of movement percent. Each level clearly shows what it means by its name.
Support and Resistance:
Any consolidation of AWPRVC candles in Ready for Short or Long Zones means the support or resistance level due to its nature, but important thing is how long the candles lasts in there or how many times repeated in the same level in AWPRVC chart zone in future.
For plotting the support or resistance you should trace range of AWPRVC candles consolidated and plot zone in standard chart candles just like following picture.
Divergence:
When standard price candles move downward but we see upward trend in clouds of AWPRVC candles that means we should face Bullish Trend because of the divergence and vice versa. You can see perfect example in following picture.
Signal:
Alert of Long :
Bullish candle cross both cloud down and up level simultaneously.
Confirmed Long :
AWPRVC candles cross up turn trend level and pullback to cloud up level.
Take profit of Long:
Any cross down of the AWPRVC candles from surly short level of chart.
Alert of Short :
Bearish candle cross both cloud up and down level simultaneously.
Confirmed Short :
AWPRVC candles cross down turn trend level and pullback to cloud down level.
Take profit of Short:
Any cross up of the AWPRVC candles from surly long level of chart.
Notes:
Use moving averages cross of standard chart candles as lead to be in positions more as they are good representative of trend.
As long as AWPRVC candles or Cloud levels are in Bullish Zone, you can stay in Long positions.
Cloud level thickness means the power of trend and can be use as confirmation of powerful trend, so when cloud levels tight or going to cross each other it means the trend is going to be reversed.
It is the result of many years of experience in markets and there are so many details about this AWPRVC chart which I am in the experiment phase to publish in the future, so please help me with your ideas and do not hesitate to comment and inform me any suggestions or criticism.
Essa's Indicator 2.0Essa's Indicator V2: Beginner's Guide
This custom TradingView indicator has been designed to help you identify key trading opportunities based on session highs/lows, volatility, and moving averages. Below is a breakdown of the main features:
1. Exponential Moving Averages (EMAs)
Fast EMA (Blue Line): Tracks the short-term market trend (default: 9-period EMA).
Slow EMA (Red Line): Tracks the longer-term market trend (default: 21-period EMA).
You can turn on/off the EMAs using the "Show EMAs" option in the settings.
EMAs help smooth out price action and give a clearer picture of trends. A crossover of the fast EMA above the slow EMA can signal an upward trend, while the reverse may indicate a downward trend.
2. Session Highs and Lows
The indicator tracks price highs and lows for three major trading sessions:
London Session (Red): Highlighted in red. Active between 08:00 and 17:00 (LDN timezone) or 03:00 and 12:00 (NY timezone).
New York Session (Blue): Highlighted in blue. Active between 12:00 and 21:00 (LDN timezone) or 07:00 and 16:00 (NY timezone).
Asia Session (Yellow): Highlighted in yellow. Active between 22:00 and 08:00 (LDN timezone) or 18:00 and 03:00 (NY timezone).
Highs and lows for each session are plotted on the chart as lines. Breakouts from these levels can signal important trading opportunities:
London High/Low: Red lines.
New York High/Low: Blue lines.
Asia High/Low: Yellow lines.
The background color also changes depending on the active session:
London: Light red background.
New York: Light blue background.
Asia: Light yellow background.
3. Breakout Alerts
You can set alerts when the price breaks above or below session highs/lows:
Break Above London High: Alert triggered when the price crosses the London session high.
Break Below London Low: Alert triggered when the price falls below the London session low.
Similar alerts exist for the New York and Asia sessions as well.
4. Volatility-Adjusted EMA
The EMAs in this indicator are adjusted based on volatility (ATR - Average True Range). This allows the EMAs to respond to market conditions more dynamically, giving you more accurate trend readings in volatile markets.
5. ZigZag Feature (Optional)
You can enable the ZigZag feature to help visualize the price action's highs and lows:
ZigZag Lines: Highlight major peaks and troughs in price movements, helping you spot trends more easily.
This is helpful for identifying reversals or trend continuations.
6. Fractal Markers
This indicator uses fractals to mark potential turning points in the market:
Green Triangles (Above the Price): Indicate up fractals (potential reversal points where the price could move upwards).
Red Triangles (Below the Price): Indicate down fractals (potential reversal points where the price could move downwards).
Fractals can be a helpful confirmation tool when identifying entry and exit points.
7. Custom Timezone Options
You can choose between London (LDN) and New York (NY) timezones in the settings to adapt the session times to your trading location. This ensures the session high/low markers are displayed correctly for your trading region.
By default, the New York (NY) timezone is enabled for FXCM charts in the UK.
For BTC charts, you will need to switch to the appropriate time zone manually.
Thanks
Essa

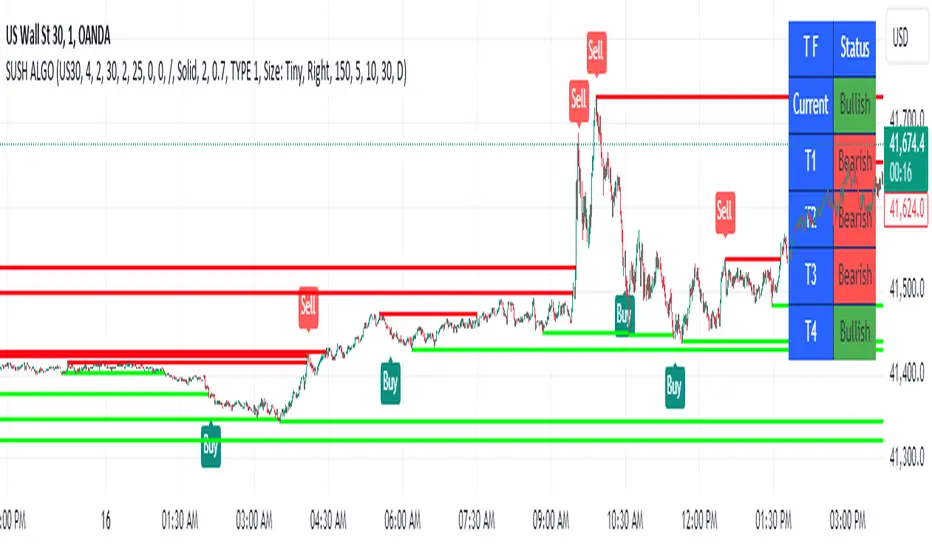
SUSH ALGOStep-by-Step Guide for Trading Using the Script
1. Asset Selection
When applying this script, the first thing to do is select your desired asset to trade.
You can select from the following assets within the script:
Scalping
Gold
USD/JPY
EUR/USD
EUR/JPY
BTC/USD
NIFTY 50
The parameters for the strategy (e.g., q, r, s, and ADX Threshold) will adjust automatically based on your selected asset. If you want to use custom parameters, turn on the Use Manual Settings option.
2. Adjust Manual Settings (Optional)
Use Manual Settings: Toggle this if you want to input your custom values for the strategy parameters.
Manual q: Affects swing period calculation.
Manual r: Affects the smoothing in the calculation of the oscillator.
Manual s: Affects the smoothing period of the main line of the oscillator.
Manual Signal Length: Length of the signal line for generating buy/sell signals.
Manual ADX Threshold: Adjusts the ADX value to filter trades based on trend strength.
3. Reading the SMI (Stochastic Momentum Index) Oscillator
SMI: This indicator oscillates between overbought and oversold levels, signaling potential entry and exit points.
Overbought Level: +30
Oversold Level: -30
The signal line is calculated based on the smoothed SMI value.
A crossover above the signal line in the oversold region (< -30) signals a buy.
A crossunder below the signal line in the overbought region (> +30) signals a sell.
4. Trade Signal Alerts
Buy Signal Alert: Triggered when the SMI crosses over the signal line in the oversold zone, and ADX exceeds the threshold.
Sell Signal Alert: Triggered when the SMI crosses under the signal line in the overbought zone, and ADX exceeds the threshold.
5. Entry, Stop Loss, and Target Levels
Entry Line: The script will plot an entry line at the close price when a buy or sell signal is triggered.
Stop Loss: A stop loss will be set based on the lowest low (for buy signals) or highest high (for sell signals) of the previous candles.
Take Profit Targets:
Target 1 (TP1): 3 times the size of the entry candle.
Target 2 (TP2): 6 times the size of the entry candle.
Target 3 (TP3): 10 times the size of the entry candle.
Make sure the Show Entry, Show Stop Loss, and Show Targets toggles are enabled to visualize these lines on the chart.
6. Monitoring the ADX (Average Directional Index)
The ADX value filters weak signals, ensuring that you trade only in trending markets.
If ADX > adxThreshold, the trend is strong, and the buy or sell signal becomes valid.
If ADX < adxThreshold, the trade signals are ignored to avoid trading in sideways markets.
7. Box, Line, and Label Toggles for Swing Highs/Lows
The script allows you to visualize swing highs and lows for better market context. You can toggle the following options:
Show Boxes: Displays rectangular boxes around the swing highs and lows.
Show Swing Lines: Plots lines at swing highs and lows for visual confirmation of key price levels.
Show Labels: Adds text labels to the swing levels, indicating whether they represent a swing high or low.
8. Customize Appearance (Optional)
You can change the appearance of the boxes, lines, and labels, such as their color, width, and style (solid or dotted), from the Appearance settings.
9. Monitor Volume and Open Interest (Optional)
You can also track volume and open interest (OI) data from various exchanges like Binance and BitMEX to get additional confirmations.
Steps for Trading
1.Select your asset from the drop-down menu based on your trading preferences.
2.Adjust manual settings (optional) if you want to use your own parameters for the strategy.
3.Wait for a buy or sell signal to trigger based on the crossover of the SMI oscillator in the overbought/oversold regions.
4.Once a signal is triggered, check for the plotted entry price, stop loss, and take profit levels on your chart.
5.Monitor the ADX value to ensure that the market is trending strongly.
6.If the trade meets your criteria, enter the trade at the indicated price.
Set your stop loss and take profit orders as indicated by the script.
Key Notes
# This strategy is designed for both trending and mean-reversion markets depending on the asset and the ADX value.
# Make sure to practice proper risk management by adjusting the stop loss and position size based on your risk tolerance.
best indicator at 15 minut This Pine Script code builds an indicator called EMA Crossover with Historical Price Projection that combines two components:
EMA Crossover Strategy:
EMA 9 and EMA 21: The script calculates two exponential moving averages (EMAs) using the ta.ema() function. The crossover between these EMAs generates buy/sell signals.
A bullish crossover (when EMA 9 crosses above EMA 21) signals a buy.
A bearish crossover (when EMA 9 crosses below EMA 21) signals a sell.
These buy/sell signals are visualized on the chart using the plotshape() function with green and red symbols.
Historical Price Projection:
The code projects future prices based on historical price trends. It takes into account growth factors (user-defined drift percentages) to estimate future prices.
Projection Line: It draws a projection line from the anchor point (set by the user) using historical data. The drift factor allows you to control the projection's slope.
Forecasting Area: It shows an optional area around the projected price, adjusting the width with a user-defined growth factor for the forecast's uncertainty.
Key Sections:
Inputs:
User-defined inputs for controlling the growth factor, line styles, and forecasting area settings.
An anchoring point is provided to determine from which bar the price projection should start.
EMA Crossover:
The crossover conditions for EMA 9 and EMA 21 are defined, and the script generates buy and sell signals at those crossovers.
Historical Price Projection:
It stores the percentage changes between bars in barDeltaPercents.
It projects the future price based on these percentages and the user-defined drift factor.
The projected price is visualized using polyline.new(), and a shaded area can be added to show the range of price possibilities.
Execution Logic:
The script runs when the current time is greater than the anchor point.
If the anchor point is too far back in history, it gives a warning via the showInfoPanel function.
As new bars are confirmed, the drift is calculated, and the projection line and area are updated based on historical price changes.
Overall Flow:
It gathers price data up to 500 bars from the anchor point.
Based on the historical price trend, it forecasts the future price with a projection line and an optional shaded area.
The crossover logic for EMA 9 and 21 provides actionable signals on when to buy or sell.

Simplified Market ProfileVolume Bins: This script divides the price range into num_bins equal price levels. Each bin holds the cumulative volume for that price range.
Profile Length: The number of past bars that the profile considers for building the volume histogram.
Bin Size: The price range between bins is determined by dividing the difference between the highest and lowest prices over the specified range.
Volume Calculation: The script iterates over each bar within the specified range, determining which price bin the bar’s volume should be added to.
Plotting: The script visualizes the volume profile as lines plotted horizontally at different price levels, with thickness proportional to the volume traded at that level.

Helacator Ai ThetaHelacator Ai Theta is a state-of-the-art advanced script. It helps the trader find the possibility of a trend reversal in the market. By finding that point at which the three black crows pattern combines with the three white soldiers pattern, it is the most cherished pattern in technical analysis for its signal of strong bullish or bearish momentum. Therefore, it is a very strong predictive tool in the ability of shifting markets.
Key Highlights: Three White Soldiers and Three Black Crows Patterns
The script identifies these candlestick formations that consist of three consecutive candles, either bullish (Three White Soldiers) or bearish (Three Black Crows). These patterns help the trader identify possible trend reversal points as they provide an early signal of a change in the market direction. It is with great care that the script is written to evaluate the position and relationship between the candlesticks for maintaining the accuracy of pattern recognition. Moving Averages for Trend Filtering:
Two important ones used are moving averages for filtering any signals not in accordance with the general trend. The length of these MAs is variable, allowing the traders to be in a position to adapt the script for use under different market conditions. The moving averages ensure that signals are only taken in the direction that supports the general market flow, so it leads to more reliability within the signals. The MAs are not plotted on the chart for the sake of clarity, but they still perform a crucial function in signal filtering and can be displayed optionally for a more detailed investigation. Cooldown filter to reduce over-trading
This is part of what is implemented in the script to prevent generation of consecutive signals too quickly. All this helps to reduce market noise and not overtrade—only when market conditions are at their best. The cooldown period can be set to be adjusted according to the trader's preference, making the script more versatile in its use. Practical Considerations: Educational Purpose: This script is for educational purposes only and should be part of a comprehensive trading approach. Proper risk management techniques should be observed while at the same time taking into consideration prevailing market conditions before making any trading decision.
No Guaranteed Results: The script is aimed at bringing signal accuracy into improvement to align with the broader market trend and reducing noise, but past performance cannot guarantee future success. Traders should use this script within their broad trading approach. Clean and Simple Chart Display: The primary goal of this script is to have a clear and simple display on the chart. The signals are prominently marked with "BUY" and "SELL," and the color of the bars has changed according to the last signal, thus traders can easily read the output. Community and Open Source Open Source Contribution: This script is open for contribution by the TradingView community. Any suggestions regarding improvements are highly welcomed. Candlestick patterns, moving averages, and the combination of the cooldown filter are presented in such a way as to give traders something special, and any modifications or extra touch by the community is appreciated. Attribution and Transparency: The script is based on standard technical analysis principles and for all parts inspired by or derivated from other available open-source scripts, credit is given where it is due. In this way, transparency ensures that the script adheres to TradingView's standards and promotes a collaborative community environment.

BTC Hash Rate to Price RatioDescription:
The BTC Hash Rate to Price Ratio indicator is a sophisticated tool designed to assist traders in identifying potential market turning points for Bitcoin by combining network health, market sentiment, and valuation metrics. This indicator integrates three key components—Hash Rate, RSI (Relative Strength Index), and MVRV (Market Value to Realized Value)—to provide a comprehensive analysis of Bitcoin's market dynamics.
Key Features:
Hash Rate Analysis: Assesses the computational power of the Bitcoin network, reflecting network health and miner confidence. Changes in the hash rate can signal shifts in market sentiment.
RSI (Relative Strength Index): A momentum oscillator that measures the speed and change of price movements, identifying overbought or oversold conditions. Smoothed RSI provides clearer insights into market momentum.
MVRV (Market Value to Realized Value): A valuation metric comparing Bitcoin's market value to its realized value, offering insights into whether Bitcoin is overvalued or undervalued. Smoothed MVRV enhances signal accuracy.
How It Works:
Red Zones (Sell Signals): Highlighted when both the MVRV and RSI are above the hash rate, indicating potential market tops.
Green Zones (Buy Signals): Highlighted when both the MVRV and RSI are below the hash rate and MVRV is under 15, suggesting potential market bottoms.
Customizable Parameters: Allows traders to adjust smoothing periods and signal thresholds, tailoring the indicator to different trading strategies and market conditions.
Visual Aids: Includes dotted lines at key RSI levels (15 and 75) for quick reference to potential overbought and oversold conditions.
Benefits:
Comprehensive Analysis: Combines technical, fundamental, and network metrics to offer a well-rounded perspective on market conditions.
Early Warning Signals: Aims to provide early indications of potential market reversals, helping traders make informed decisions.
Flexibility: Suitable for both short-term and long-term trading strategies, allowing for adaptation to various market environments.
Usage Tips:
Use this indicator in conjunction with other technical analysis tools and fundamental insights for best results.
Consider the broader market context and macroeconomic factors when interpreting signals.
Practice sound risk management techniques to optimize trading performance.
Unlock the potential of your Bitcoin trading strategy with the BTC Hash Rate to Price Ratio indicator, and gain deeper insights into market dynamics to make more informed trading decisions.

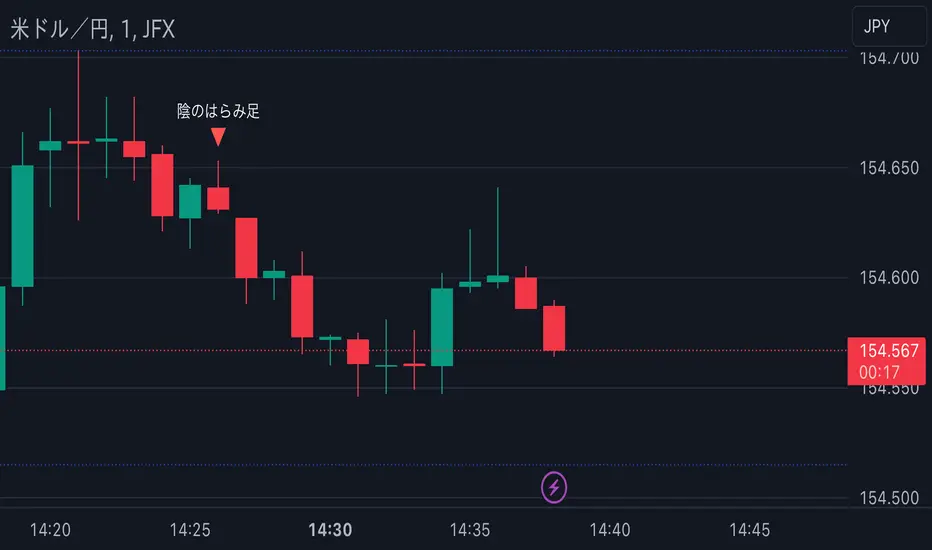
Candlestick Reversal SignalsTitle: Candlestick Reversal Signals
This Pine Script indicator is designed to identify and plot signals for two key candlestick reversal patterns: Bullish and Bearish Engulfing patterns, as well as Bullish and Bearish Harami patterns. These patterns are widely recognized for their ability to indicate potential trend reversals in the market, providing traders with valuable insights for making informed trading decisions.
Features:
• Bullish Engulfing Pattern:
• Conditions: This pattern is identified when the current candle’s close is higher than the previous candle’s open, and the current candle’s open is lower than the previous candle’s close. Additionally, the current candle’s close must be higher than the previous candle’s close, and the current candle’s open must be lower than the previous candle’s open.
• Signal: When a Bullish Engulfing pattern is detected, a green label is plotted below the relevant bar, indicating a potential upward reversal.
• Bearish Engulfing Pattern:
• Conditions: This pattern is identified when the current candle’s close is lower than the previous candle’s open, and the current candle’s open is higher than the previous candle’s close. Additionally, the current candle’s close must be lower than the previous candle’s close, and the current candle’s open must be higher than the previous candle’s open.
• Signal: When a Bearish Engulfing pattern is detected, a red label is plotted above the relevant bar, indicating a potential downward reversal.
• Bullish Harami Pattern:
• Conditions: This pattern is identified when the previous candle is a bearish candle (open higher than close), and the current candle is a bullish candle (close higher than open) that is contained within the body of the previous bearish candle.
• Signal: When a Bullish Harami pattern is detected, a green label is plotted below the relevant bar, indicating a potential upward reversal.
• Bearish Harami Pattern:
• Conditions: This pattern is identified when the previous candle is a bullish candle (open lower than close), and the current candle is a bearish candle (close lower than open) that is contained within the body of the previous bullish candle.
• Signal: When a Bearish Harami pattern is detected, a red label is plotted above the relevant bar, indicating a potential downward reversal.
Usage:
To use this script, simply add it to your TradingView chart. The script will automatically highlight the Bullish and Bearish Engulfing patterns, as well as Bullish and Bearish Harami patterns, by plotting green and red labels on the chart. These visual signals make it easy to spot potential reversal points, helping traders to identify and capitalize on trading opportunities.
Example:
• When you see a green “Bullish Engulfing” label below a candlestick, it suggests that the market might reverse upwards, signaling a potential buy opportunity.
• Conversely, a red “Bearish Engulfing” label above a candlestick suggests a potential downward reversal, signaling a potential sell opportunity.
• A green “Bullish Harami” label below a candlestick also indicates a potential upward reversal.
• A red “Bearish Harami” label above a candlestick indicates a potential downward reversal.
This indicator is a valuable addition to any trader’s technical analysis toolkit, providing clear and actionable signals based on well-established candlestick patterns. By incorporating these reversal patterns into your analysis, you can enhance your trading strategy and improve your decision-making process.
HTF LQ SweepThe following script recognises QL sweeps in the desired time frame with alarm function!
Theory:
There is liquidity above highs and below lows. If this is tapped and the market reacts strongly immediately, the probability of a reversal is greatly increased! In the chart, this is defined in such a way that a candle has its wicks BELOW the old low, but the close is ABOVE the old low. the same applies to the high, of course!
In such a case we have an "LQ Sweep"
How does the script work?
Williams 3 fractals are used as a basis. These are meaningful as lows or highs. Whenever a fractal is created, the price level is saved.
This means that not only the last fractal is relevant, but all historical fractals as long as they have not been reached!
If a candle reaches the level, but shows a rejection and closes within the level again, we have our "LQ Sweep" setup.
In the script you can select the timeframe in which the market has to be analysed. When the QL sweep occurs, an alert is triggered. This saves a lot of time because you can analyse different markets in different timeframes at the same time!
Each QL Sweep is marked in the chart when we are in the selected timeframe. These can also be deactivated so that only the last sweep is displayed.
Benefits for the trader:
An LQ sweep is a nice confirmation for a reversal.
If we have such an LQ sweep, we can wait in the lower timeframe for further confirmation, such as a structural break, to position our entries there.
The alarm function saves us a lot of time and we only go to the chart when a potential setup has been created.
You can set different time frames in the script: The selected time frame is then scanned and sends a signal when the event occurs.

Fractal Breakout Trend Following StrategyOverview
The Fractal Breakout Trend Following Strategy is a trend-following system which utilizes the Willams Fractals and Alligator to execute the long trades on the fractal's breakouts which have a high probability to be the new uptrend phase beginning. This system also uses the normalized Average True Range indicator to filter trades after a large moves, because it's more likely to see the trend continuation after a consolidation period. Strategy can execute only long trades.
Unique Features
Trend and volatility filtering system: Strategy uses Williams Alligator to filter the counter-trend fractals breakouts and normalized Average True Range to avoid the trades after large moves, when volatility is high
Configurable Trading Periods: Users can tailor the strategy to specific market windows, adapting to different market conditions.
Flexible Risk Management: Users can choose the stop-loss percent (by default = 3%) for trades, but strategy also has the dynamic stop-loss level using down fractals.
Methodology
The strategy places stop order at the last valid fractal breakout level. Validity of this fractal is defined by the Williams Alligator indicator. If at the moment of time when price breaking the last fractal price is higher than Alligator's teeth line (8 period SMA shifted 5 bars in the future) this is a valid breakout. Moreover strategy has the additional volatility filtering system using normalized ATR. It calculates the average normalized ATR for last user-defined number of bars and if this value lower than the user-defined threshold value the long trade is executed.
When trade is opened, script places the stop loss at the price higher of two levels: user defined stop-loss from the position entry price or down fractal validation level. The down fractal is valid with the rule, opposite as the up fractal validation. Price shall break to the downside the last down fractal below the Willians Alligator's teeth line.
Strategy has no fixed take profit. Exit level changes with the down fractal validation level. If price is in strong uptrend trade is going to be active until last down fractal is not valid. Strategy closes trade when price hits the down fractal validation level.
Risk Management
The strategy employs a combined approach to risk management:
It allows positions to ride the trend as long as the price continues to move favorably, aiming to capture significant price movements. It features a user-defined stop-loss parameter to mitigate risks based on individual risk tolerance. By default, this stop-loss is set to a 3% drop from the entry point, but it can be adjusted according to the trader's preferences.
Justification of Methodology
This strategy leverages Williams Fractals to open long trade when price has broken the key resistance level to the upside. This resistance level is the last up fractal and is shall be broken above the Williams Alligator's teeth line to be qualified as the valid breakout according to this strategy. The Alligator filtering increases the probability to avoid the false breakouts against the current trend.
Moreover strategy has an additional filter using Average True Range(ATR) indicator. If average value of ATR for the last user-defined number of bars is lower than user-defined threshold strategy can open the long trade according to open trade condition above. The logic here is following: we want to open trades after period of price consolidation inside the range because before and after a big move price is more likely to be in sideways, but we need a trend move to have a profit.
Another one important feature is how the exit condition is defined. On the one hand, strategy has the user-defined stop-loss (3% below the entry price by default). It's made to give users the opportunity to restrict their losses according to their risk-tolerance. On the other hand, strategy utilizes the dynamic exit level which is defined by down fractal activation. If we assume the breaking up fractal is the beginning of the uptrend, breaking down fractal can be the start of downtrend phase. We don't want to be in long trade if there is a high probability of reversal to the downside. This approach helps to not keep open trade if trend is not developing and hold it if price continues going up.
Backtest Results
Operating window: Date range of backtests is 2023.01.01 - 2024.05.01. It is chosen to let the strategy to close all opened positions.
Commission and Slippage: Includes a standard Binance commission of 0.1% and accounts for possible slippage over 5 ticks.
Initial capital: 10000 USDT
Percent of capital used in every trade: 30%
Maximum Single Position Loss: -3.19%
Maximum Single Profit: +24.97%
Net Profit: +3036.90 USDT (+30.37%)
Total Trades: 83 (28.92% win rate)
Profit Factor: 1.953
Maximum Accumulated Loss: 963.98 USDT (-8.29%)
Average Profit per Trade: 36.59 USDT (+1.12%)
Average Trade Duration: 72 hours
These results are obtained with realistic parameters representing trading conditions observed at major exchanges such as Binance and with realistic trading portfolio usage parameters.
How to Use
Add the script to favorites for easy access.
Apply to the desired timeframe and chart (optimal performance observed on 4h and higher time frames and the BTC/USDT).
Configure settings using the dropdown choice list in the built-in menu.
Set up alerts to automate strategy positions through web hook with the text: {{strategy.order.alert_message}}
Disclaimer:
Educational and informational tool reflecting Skyrex commitment to informed trading. Past performance does not guarantee future results. Test strategies in a simulated environment before live implementation

Market Structure RangesI have written a script for determining the BIAS.
It uses fractals of 3 for the highs and lows.
It works as follows:
If a range high is broken (!!!candelclose!!!), the last fractal low is selected as the new low point. The Rangelow is determined from this low point.
If a fractal high now occurs, the range high is set at this point.
This Range between the low range and high range is called "Dealing range" , this is divided at the centre - into premium and discount.
The range stays the same, until we see a body close outside this range!
The same applies to a short scenario, only in reverse.
In the indicator, the higher timeframe is selected, which determines the input for the dealing range. Then the dealing range from the higher timeframe is displayed in each timeframe that we want to use for our trades.
The indicator should be used to trade with the trend: for example, the last higher timeframe break is bullish (displayed in the table) -- called kMS
and on the other hand that we only want to take tades that are in the lower part of the range, i.e. in the discount area for buy trades.
This indicator therefore serves as a filter for the higher timeframe trend and higher timeframe premium/discount ranges.

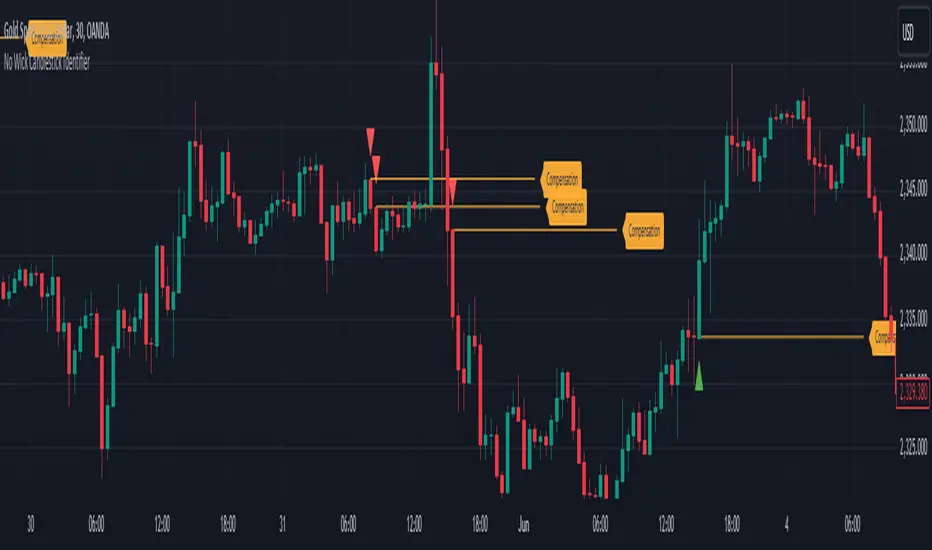
No Wick Candlestick Identifier_GOVS1. Identification of Candlestick Patterns: The script checks each candlestick to determine if it meets the criteria for a "no wick" pattern. For bullish candles, it identifies those with no bottom wick, where the open price is equal to the low and the close price is greater than the open. For bearish candles, it identifies those with no top wick, where the open price is equal to the high and the close price is lower than the open.
2. Visualization: The script plots small triangles on the chart to highlight the identified candlestick patterns. Green triangles are plotted below bullish candles with no bottom wick, while red triangles are plotted above bearish candles with no top wick.
3. Drawing Lines and Labels: Additionally, the script draws lines extending from the opening price of these candles to the right edge of the screen, visually indicating the duration of these patterns. It also adds a label "Compensation" next to each line.
Gator TailGator Tail
Building on Bill William’s Alligator, the Gator Tail provides the trader with a scaled value of deviation between the market price and the rolling average. Meant to be used as a trend reversal indicator, best results when combined with the Awesome Oscillator (AO).
Script Theory Basics
This script is based off of the Bill Williams Alligator indicator. In this indicator, the variance between the ‘jaw’ and the current price represents the deviation of price from its average. Using the alligator, the trader must identify this using their eye only. This script provides a numerical value, charted in histogram format like the Awesome Oscillator. Using the two in tandem allows the trader to identify reversal points and act on positions accordingly.
Script Technicalities
The Gator Tail value is derived as follows. To preface, the ‘jaw’ is a 13 period simple moving average, plotted 8 periods into the future on the chart. A calculation is performed on the ‘jaw’ value to extract its current value less the offset. This value is compared to the current price at the time of printing the equation. Price takes the hl2 value (high + low / 2). The variance between the two values is calculated by subtracting the jaw offset from the price value, and dividing this value by the offset value ( / jaw offset). This value prints as an absolute (irrespective of positive or negative) and gets plotted on the chart for the period. The range of values is 0.00 to 1.00.
Using Gator Tail
Any value above 0.20 is considered to be in the warning range. Values exceeding the 0.35-0.40 range are considered to be highly deviated. Highly deviated Gator Tail values combined with a color reversal from the AO indicate an entry/exit point in the chart.
Using the two indicators on top of one another provides an easy visual cue to identify market reversal points. In the example chart above, we can see the red arrows on the Gator Tail coinciding with the AO reversals to result in the chart movements in the candlestick pane.
Limitations
This indicator does not work well with cryptocurrencies (altcoins or otherwise). The prices in these markets have few ties to macroeconomic trends or performance of an underlying asset. When testing this script, it was not found to be a reliable predictor of market reversals. This script is meant to be used with standard equities (stocks, stock options, currencies) where markets follow a reasonable level of predictability and have some underlying tie to real world events and relativity to historical prices.
Momentum Alligator 4h Bitcoin StrategyOverview
The Momentum Alligator 4h Bitcoin Strategy is a trend-following trading system that operates on dual time frames. It utilizes the 1D Williams Alligator indicator to identify the prevailing major price trend and seeks trading opportunities on the 4-hour (4h) time frame when the momentum is turning up. The strategy is designed to close trades if the trend fails to develop or holding position if price continues increasing without any significant correction. Note that this strategy is specifically tailored for the 4-hour time frame.
Unique Features
2-layers market noise filtering system: Trades are only initiated in the direction of the 1D trend, determined by the Williams Alligator indicator. This higher time frame confirmation filters out minor trade signals, focusing on more substantial opportunities. At the same time, strategy has additional filter on 4h time frame with Awesome Oscillator which is showing the current price momentum.
Flexible Risk Management: The strategy exclusively opens long positions, resulting in fewer trades during bear markets. It incorporates a dynamic stop-loss mechanism, which can either follow the jaw line of the 4h Alligator or a user-defined fixed stop-loss. This flexibility helps manage risk and avoid non-trending markets.
Methodology
The strategy initiates a long position when the d-line of Stochastic RSI crosses up it's k-line. It means that there is a high probability that price momentum reversed from down to up. To avoid overtrading in potentially choppy markets, it skips the next two trades following a winning trade, anticipating sideways movement after a significant price surge.
This strategy has two layers trades filtering system: 4h and 1D time frames. The first one is awesome oscillator. It shall be increasing and value has to be higher than it's 5-period SMA. This is an additional confirmation that long trade is opened in the direction of the current momentum. As it was mentioned above, all entry signals are validated against the 1D Williams Alligator indicator. A trade is only opened if the price is above all three lines of the 1D Alligator, ensuring alignment with the major trend.
A trade is closed if the price hits the 4h jaw line of the Alligator or reaches the user-defined stop-loss level.
Risk Management
The strategy employs a combined approach to risk management:
It allows positions to ride the trend as long as the price continues to move favorably, aiming to capture significant price movements. It features a user-defined stop-loss parameter to mitigate risks based on individual risk tolerance. By default, this stop-loss is set to a 2% drop from the entry point, but it can be adjusted according to the trader's preferences.
Justification of Methodology
This strategy leverages Stochastic RSI on 4h time frame to open long trade when momentum started reversing to the upside. On the one hand, Stochastic RSI is one of the most sensitive indicator, which allows to react fast on the potential trend reversal. On the other hand, this indicator can be too sensitive and provide a lot of false trend changing signals. To eliminate this weakness we use two-layers trades filtering system.
The first layer is the 4h Awesome oscillator. This is less sensitive momentum indicator. Usually it starts increasing when price has already passed significant distance from the actual reversal point. The strategy opens long trade only is Awesome oscillator is increasing and above it's 5-period SMA. This approach increases the probability to filter the false signals during the choppy market or if the reversal is false.
The second layer filter is the Williams Alligator indicator on 1D time frame. The 1D Alligator serves as a filter for identifying the primary trend and increases probability to avoid the trades with low potential because trading against major trend usually is more risky. It's much better to catch the trend continuation than local bounce.
Last but not least feature of this strategy is close trades condition. It uses the flexible approach. First of all, user can set up the fixed stop-loss according to his own risk-tolerance, by default this value is 2% of price movement. It restricts the potential loss at the moment when trade has just been opened. Moreover strategy utilizes the 4h Williams Alligator's jaw line to exit the trade. If price fell below it trade is closed. This approach helps to not keep open trade if trend is not developing and hold it if price continues going up.
Backtest Results:
Operating window: Date range of backtests is 2021.01.01 - 2024.05.01. It is chosen to let the strategy to close all opened positions.
Commission and Slippage: Includes a standard Binance commission of 0.1% and accounts for possible slippage over 5 ticks.
Initial capital: 10000 USDT
Percent of capital used in every trade: 50%
Maximum Single Position Loss: -3.04%
Maximum Single Profit: +29.67%
Net Profit: +6228.01 USDT (+62.28%)
Total Trades: 118 (24.58% win rate)
Profit Factor: 1.71
Maximum Accumulated Loss: 1527.69 USDT (-11.52%)
Average Profit per Trade: 52.78 USDT (+0.89%)
Average Trade Duration: 60 hours
These results are obtained with realistic parameters representing trading conditions observed at major exchanges such as Binance and with realistic trading portfolio usage parameters.
How to Use:
Add the script to favorites for easy access.
Apply to the 4h timeframe desired chart (optimal performance observed on the BTC/USDT).
Configure settings using the dropdown choice list in the built-in menu.
Set up alerts to automate strategy positions through web hook with the text: {{strategy.order.alert_message}}
Disclaimer:
Educational and informational tool reflecting Skyrex commitment to informed trading. Past performance does not guarantee future results. Test strategies in a simulated environment before live implementation

Turbo Oscillator [RunRox]Introducing Turbo Oscillator by RunRox, our new indicator that combines a multitude of useful and unique features, which we will detail in this post.
List of Advanced Technologies:
Real-Time Divergences: Detects discrepancies between price movements and oscillator indicators to forecast potential price reversals.
Real-Time Hidden Divergences: We identify hidden divergences in real-time. These are not the standard type of divergences; they are opposite to regular divergences, providing unique insights into potential market movements.
Overbought and Oversold Zones: Identifies areas where the market is potentially overextended, suggesting possible entry and exit points.
Signal Line: Indicates the market direction, helping traders to quickly understand current trends.
Money Flow Histogram: Shows the flow of money into and out of the market, providing insights into buying and selling pressure.
Predicted Reversal Zones: Pinpoints areas where the market might experience reversals, aiding in strategic planning and risk management. These zones also serve as potential areas for taking profits, enhancing their utility for exit strategy planning.
Customizable Alerts: You can flexibly set up alerts for any events detected by our indicator, ensuring you stay informed about critical market movements.
To begin with, I would like to describe the difference between classic divergences and hidden divergences.
As you can see, these are opposite situations. Our oscillator identifies both types of divergences and displays them in real-time.
Divergences can serve as points where the price might reverse in the opposite direction, making both classic and hidden divergences powerful tools for spotting reversal points. I'll show a few examples of how divergences are used in our oscillator.
Classic Divergences - which we identify in real-time. As you can see, the price often reacts strongly to the formation of these divergences, frequently changing its direction.
Hidden Divergences - we also observe frequent movement in the opposite direction on the chart. The advantage of our indicator is that we show divergences in real-time without delays, allowing you to react immediately to trend changes.
Overbought and Oversold Zones - These zones allow you to see trend changes when the price is clearly overbought or oversold. When the color changes from a contrasting shade to a neutral one, you can observe the trend shift. The lines work by combining the positivity/negativity of the histogram, the positivity/negativity of the signal line, and the direction of the signal line (red/green). This sophisticated interaction provides precise insights into market conditions, making it an invaluable tool for traders.
Signal Line - This provides insights into trend changes and price reversals. The points on the line better indicate the beginning of a trend shift. These points can vary in size, offering a clearer understanding of the strength of the emerging trend. This feature works in combination with RSI, Stochastic, and MFI. RSI and MFI are top-tier indicators, while Stochastic adds responsiveness and sensitivity to trend changes, ensuring you capture every market movement accurately and promptly.
Money Flow Histogram - As shown in the example, our histogram displays the divergence between money flow and the actual price. You can see that while the price is rising, the money flow is decreasing, indicating insufficient demand for the asset and an imminent trend change. This feature uses MFI with an extended period, providing a more comprehensive and accurate analysis of market conditions. The extended period enhances the reliability of the Money Flow Index, making it an essential tool for identifying subtle shifts in market dynamics.
Predicted Reversal Zones - We automatically identify potential price reversal zones and display them above our overbought and oversold zones. In cases of strong overbought or oversold conditions, we detect potential price pullbacks and mark the beginning of a trend change. This helps you better identify trend shifts. We recommend considering these zones as potential take profit points for your trades.
Customizable Alerts - Our flexible alert system allows you to receive notifications only for the events you are interested in. These can include:
1. Classic Divergences
2. Hidden Divergences
3. Overbought or Oversold conditions on the status line
4. Strong Overbought or Oversold conditions on the status line
5. Signals from the signal line
6. Reversal zones in any direction
Our oscillator is a unique indicator that provides a comprehensive understanding of price movements. It can be used as a standalone tool for analyzing price action.
Here are a few examples of using our Oscillator in practice:
In the example above, you can see three conditions that have formed for a potential trade:
1. Clear overbought condition with a formed reversal point.
2. Decreasing Money Flow Index diverging from the rising price.
3. Formed classic divergence.
The entry point could be the formed divergence, while the exit point could be the overbought condition at the bottom of the oscillator along with the reversal points.
Here's another example of using hidden divergence, where you can see three conditions for a potential trade:
1. Overbought zone
2. Formed hidden divergence
3. Start of bearish movement indicated by the signal line
You can enter the trade either when the hidden divergence forms or wait for confirmation of the trend change by the signal line and enter the trade when the corresponding signal forms on the signal line. The exit point could be the opposite reversal point or the formation of a new hidden divergence.
We have demonstrated a few examples of how you can use our indicator, but we are confident that you will find many more applications in your own strategies.
Oscillator offers a variety of customizable parameters to tailor the indicator to your trading preferences. Here’s what our settings include:
Signal Line
Turn On/Off: Enable or disable the signal line.
Length: Set the length period for the signal line calculation.
Smooth: Adjust the smoothing level of the signal line for more accurate display.
Histogram
Turn On/Off: Enable or disable the histogram.
Length: Set the length period for the histogram calculation.
Smooth: Adjust the smoothing level of the histogram.
Other
Show Divergence Line: Display divergence lines on the chart.
Show Hidden Divergence: Display hidden divergences.
Show Status Line: Show the status line indicating overbought or oversold conditions.
Show TP Signal: Display signals for take profit.
Show Reversal Points: Display potential trend reversal points.
Delete Broken Divergence Lines: Remove broken divergence lines from the chart.
Alerts Customization
Signal Line Bull/Bear: Set alerts for bullish or bearish signals from the signal line.
TP Bull/Bear: Set alerts for take profit signals.
Status Bull/Bear: Set alerts for bullish or bearish status conditions.
Status Bull+/Bear+: Set enhanced alerts for stronger bullish or bearish status conditions.
Divergence Bull/Bear: Set alerts for bullish or bearish divergences.
Hidden Divergence Bull/Bear: Set alerts for hidden bullish or bearish divergences.
With these comprehensive settings, you can fine-tune the Oscillator to perfectly fit your trading strategy and preferences.
Our indicator utilizes technologies such as RSI, Stochastic, and Money Flow Index, with numerous enhancements from our team. It includes exclusive features such as real-time detection of hidden and classic divergences, identification of reversal points using our unique methodology, and much more.
Disclaimer:
While we consider our Turbo Oscillator to be an excellent tool, it is important to understand that past performance is not indicative of future results. We recommend approaching market analysis comprehensively, using a combination of tools and techniques to make well-informed trading decisions. Always consider the full range of market data and risks when using any trading indicator.

Alligator + MA Trend Catcher [TradeDots]The "Alligator + MA Trend Catcher" is a trading strategy that integrates the William Alligator indicator with a Moving Average (MA) to establish robust entry and exit conditions, optimized for capturing trends.
HOW IT WORKS
This strategy combines the traditional William Alligator set up with an additional Moving Average indicator for enhanced trend confirmation, creating a user-friendly backtesting tool for traders who prefer the Alligator method.
The original Alligator strategy can frequently present fluctuations, even in well-established trends, leading to potentially premature exits. To mitigate this, we incorporate a Moving Average as a secondary confirmation measure to ensure the market trend has indeed shifted.
Here’s the operational flow for long orders:
Entry Signal: When the price rises above the Moving Average, it confirms a bullish market state. Enter if Alligator spread in an upward direction. The trade remains active even if the Alligator indicator suggests a trend reversal.
Exit Signal: The position is closed when the price falls below the Moving Average, and the Alligator spreads in the downward direction. This setup helps traders to maintain positions through the entirety of the trend for maximum gain.
APPLICATION
This strategy is tailored for assets with significant, well-defined trends, such as Bitcoin and Ethereum, which are known for their high volatility and substantial price movements.
This strategy offers a low win-rate but high reward configuration, making asset selection critical for long-term profitability. If you choose assets that lack strong price momentum, there's a high chance that this strategy may not be effective.
For traders seeking to maximize gains from large trends without exiting prematurely, this strategy provides an aggressive yet controlled approach to riding out substantial market waves.
DEFAULT SETUP
Commission: 0.01%
Initial Capital: $10,000
Equity per Trade: 80%
RISK DISCLAIMER
Trading entails substantial risk, and most day traders incur losses. All content, tools, scripts, articles, and education provided by TradeDots serve purely informational and educational purposes. Past performances are not definitive predictors of future results.

Trend Catcher Strategywhat is Trend Catcher Strategy?
it is a strategy that opens long or short positions in the direction of the trend.
what it does?
TCS detects trend formations using its own unique method. Then, it opens a position in the direction of the trend and closes a part of the opened transaction (half according to default values) when the price reaches a certain level, and moves the remaining position to the point where it thinks the trend is over. You can easily understand how it works by looking at the images:
how it does it?
It obtains a value called a "limit" by dividing the difference between the highest value and the lowest value in a certain range (that is, the vector sum) to the sum of the lengths of the candles in a certain range (the total distance traveled). then multiplies this by 100 to get a percentage value. The closer this value is to 100, the stronger the trend.
