RSI Multi-Timeframe TableHow the RSI Multi-Timeframe Table Indicator Works
This indicator displays a table showing the RSI (14) from multiple timeframes at the same time.
It helps you quickly see whether the RSI is in overbought or oversold zones across different periods (1m, 5m, 15m, 30m, 1h, 4h, and 1D).
Below is a clear explanation of how each part works:
1) Timeframes Used
The indicator analyzes the RSI from the following timeframes:
1 minute (1m)
5 minutes (5m)
15 minutes (15m)
30 minutes (30m)
1 hour (1h)
4 hours (4h)
1 day (1D)
Each row of the table represents one of these timeframes.
2) How the RSI Is Retrieved
For each timeframe, the script uses the request.security() function to fetch the RSI(14) value from that specific timeframe, even if your current chart is set to a different one.
Example: On a 1h chart, you can still see the RSI from 1m, 5m, 30m, etc.
3) Table Structure
The table appears in the top-right corner and contains 8 columns:
TF – shows the timeframe name
RSI – shows the RSI value with two decimal places
10 – marks if RSI is ≤ 10
20 – marks if RSI is ≤ 20
30 – marks if RSI is ≤ 30
70 – marks if RSI is ≥ 70
80 – marks if RSI is ≥ 80
90 – marks if RSI is ≥ 90
The extreme levels (10, 20, 80, 90) help identify possible reversal zones.
4) Markings in the Table
When a condition is true, a ● circle appears in the corresponding cell.
Examples:
If the 5m RSI is ≤ 20, a circle appears in the 20 column for the 5m row.
If the 1H RSI is ≥ 80, a circle appears in the 80 column for the 1H row.
Colors also help interpretation:
Red for strong oversold levels (≤10)
Orange and yellow for intermediate levels
Green, teal, and blue for overbought levels
5) Alerts
The indicator includes four built-in alerts:
RSI ≤ 10
RSI ≤ 20
RSI ≥ 80
RSI ≥ 90
These alerts use the RSI from the current chart timeframe.
To enable them:
Open Alerts in TradingView
Click Create Alert
Select the indicator
Choose the alert you want
Confirm
6) Purpose of This Indicator
It is useful for:
Quickly checking market strength across multiple timeframes
Identifying when several periods are overbought or oversold
Avoiding trades against market momentum
Helping confirm potential reversal points
Summary
This indicator creates a table that shows RSI values from multiple timeframes and visually highlights overbought or oversold conditions in each one.
It also includes ready-to-use alerts for the most extreme RSI levels.
빌 윌리엄스 인디케이터

DR/IDR, fractals, break + EMA Clouds + VWAPThis indicator is a powerful, multi-layered trading tool that combines three distinct forms of market analysis—volume, trend, and opening volatility—onto a single chart.
1. Opening Range Breakout (ORB) System
This is the foundation of the indicator, designed to capture the initial volatility and set key price boundaries for the trading day.
Time Focus: The indicator's primary analysis is centered on a specific, user-defined time period (default is 9:30 AM to 10:30 AM New York Time). Nothing related to the ORB drawing will appear on the chart before this session starts.
Wick High/Low (The Trigger): These lines track the absolute highest and lowest prices reached during the time window. They define the full extent of the initial range and are used to determine when a genuine breakout occurs.
Body High/Low (The Range & Targets): These lines track the highest and lowest open/close prices of the candles within the session. This area forms the central, shaded zone, representing the core consolidation area.
Range Shading: The background between the Body High and Body Low is shaded, but this visual feature only appears during the active forming time window (e.g., 9:30 AM to 10:30 AM) to maintain chart clarity.
Fractals: While the range is forming, the indicator detects 5-bar Williams Fractal patterns that occur inside the range. These small triangles (▲ or ▼) highlight minor reversal points established by the early trading action.
Breakout Signal: After the user-defined time window closes, the indicator waits. If a subsequent candle's price moves above the Wick High or below the Wick Low, a "BREAK" label is displayed on that candle. It is programmed to label only the first decisive break in each direction per day.
Extension Targets: When a breakout occurs, target lines are automatically projected above the Body High (for a bullish break) or below the Body Low (for a bearish break). The distance between these targets is calculated based on a user-defined fraction (e.g., 0.5 steps) of the total height of the Body Range.
Line Cutoff: For tidiness, you can set a "Stop Time" (e.g., 4:00 PM) after which the ORB lines will automatically disappear.
2. EMA Clouds (Trend and Momentum)
Four distinct Exponential Moving Average (EMA) clouds are plotted to provide a dynamic, multi-speed view of the market's trend and momentum.
Structure: Each "Cloud" is the shaded area between two EMAs (one shorter length and one longer length). The indicator includes four customizable pairs (defaulting to common settings like 8/9, 8/14, 34/50, and 14/21).
Trend Coloring: The clouds are color-coded:
Bullish (Greenish): The shorter EMA is trading above the longer EMA, signaling upward momentum.
Bearish (Reddish): The shorter EMA is trading below the longer EMA, signaling downward momentum.
Application: These clouds are used to confirm the overall market direction or identify potential zones of support and resistance.
3. Volume-Weighted Average Price (VWAP)
The VWAP is a crucial anchor for measuring the market's efficiency throughout the trading day.
Function: It calculates the average price of the asset, giving more weight to prices where higher volume was traded.
Context: It helps traders quickly determine if the current price is trading at a premium (above VWAP) or a discount (below VWAP) relative to the day's volume.
Reset: The VWAP line automatically resets at the beginning of each trading day.
Customization: The VWAP line can be toggled on or off, and its color and width are fully adjustable.

DR/IDR fractals break candle (ChadAnt)This indicator is an Opening Range Breakout (ORB) tool. It identifies the high and low price range established during a specific time window (e.g., the first hour of trading, 9:30–10:30 AM NY time). Once that time window closes, it watches for the price to "break out" of that range and projects profit targets based on the size of the initial range.
Key Features & How They Work
1. The Opening Range (The Box)
Time Window: The indicator waits for your specific start time (default 9:30 AM NY). It does not draw anything before this time.
The "Wicks": It tracks the absolute highest and lowest prices reached during this time (the Wicks). These act as your Breakout Triggers.
The "Body": It tracks the highest and lowest candle closes/opens during this time. This creates a shaded "zone" on your chart, representing the core area where most trading occurred.
Shading: To keep your chart clean, the background shading only appears during the forming time window.
2. Breakout Signals
Once the time window ends (e.g., 10:30 AM), the indicator "locks" the levels.
It then waits for a candle to move above the Wick High or below the Wick Low.
The Signal: When this happens, a label ("BREAK") appears on the chart.
Green Label: Bullish breakout (price went above the range).
Red Label: Bearish breakout (price went below the range).
Note: It only signals the first breakout of the day to avoid false alarms during choppy markets.
3. Extension Targets (Profit Levels)
When a breakout signal occurs, the indicator automatically draws target lines (extensions).
Calculation: These targets are based on the height of the "Body" zone (the shaded area).
Example: If your setting is 1.0, the indicator measures the height of the shaded body range and projects that exact distance above the breakout point. This is often used as a "Measured Move" target.
You can customize how many lines appear and how far apart they are (e.g., 0.5, 1.0, 1.5 times the range size).
4. Williams Fractals
During the opening range time, the indicator looks for specific price patterns called "Williams Fractals" (a 5-candle pattern that highlights potential turning points).
If a fractal peak or valley occurs inside your opening range, it marks it with a small triangle (▲ or ▼). Traders often use these as early signs of support or resistance forming inside the range.
5. Clean Visuals
Line Cutoff: You can set a "Stop Time" (e.g., 16:00 or 4:00 PM). The lines will stop drawing at that time so they don't clutter your chart overnight.
Gap Handling: The lines are programmed to break cleanly between days, so you don't see messy diagonal lines connecting yesterday's close to today's open.
Summary of Settings You Can Change
Session Time: When the range starts and ends.
Line Stop Time: When the lines should disappear for the day.
Visuals: Colors, line width, and style (solid, dotted, dashed).
Extensions: How many target lines to draw and the step size (e.g., 0.5x, 1.0x).
Fractals: Toggle the triangle icons on/off.

Volume Surge - First Candle Break (v6)thisisavolumesurgeindicator will help with trading. use it to identify on 5 minutes
thisisavolumesurgeindicator will help with trading. use it to identify on 5 minutes
thisisavolumesurgeindicator will help with trading. use it to identify on 5 minutes

Strategia S&P 500 vs US10Y Yield (od 2000)This strategy explores the macroeconomic relationship between the equity market (S&P 500) and the debt market (10-Year Treasury Yield). Historically, rapid spikes in bond yields often exert downward pressure on equity valuations, leading to corrections or bear markets.
The goal of this strategy is capital preservation. It attempts to switch to cash when yields are rising too aggressively and re-enter the stock market when the bond market stabilizes.

Terils 1hr HTF EMA Add-On EMA 50/100its EMA 50 and EMA 100 in 1 her time frame.
its EMA 50 and EMA 100 in 1 her time frame.
its EMA 50 and EMA 100 in 1 her time frame.
its EMA 50 and EMA 100 in 1 her time frame.
its EMA 50 and EMA 100 in 1 her time frame.
LETHINH Pinbar📌 PinBar Minimal Detector — Description (English)
PinBar Minimal Detector is a clean and efficient tool designed to detect high-quality pin bars based purely on candle geometry.
This script focuses on the core characteristics of a true pin bar: a long rejection wick and a small candle body, without adding unnecessary complexity. It is ideal for traders who want fast, reliable signal detection without noise.
⸻
✨ Key Features
• Detects both bullish and bearish pin bars.
• Fully configurable wick/body ratio.
• Optional filter for maximum opposite wick size.
• Option to ignore candles with extremely small bodies.
• Clean chart display with simple labels (“PIN”).
• Includes alert conditions for automated notifications (webhook, popup, email, etc.).
• Lightweight and optimized for fast execution on any timeframe.
⸻
🔍 Detection Logic
A candle qualifies as a bullish pin bar when:
• The lower wick is at least X times larger than the body.
• The upper wick is relatively small (optional filter).
• The body is above the minimum body threshold.
A candle qualifies as a bearish pin bar when:
• The upper wick is at least X times larger than the body.
• The lower wick is relatively small.
• The body meets the minimum size requirement.
This ensures that only candles showing strong rejection are highlighted.
⸻
⚙️ Input Parameters
1. wick/body ratio
Defines how many times longer the main wick must be compared to the candle body.
For example:
• 3.0 → wick must be at least 3× the body
• 4.0–5.0 → only very strong pin bars
2. opposite wick max (factor)
The maximum allowed size of the wick on the opposite side, relative to the body.
Example:
• 0.5 → opposite wick ≤ 50% of body
• Lower values = stricter filtering
3. min body px
Filters out candles with bodies that are too small (low volatility candles).
4. show labels
Enable or disable the “PIN” labels on the chart.
⸻
🚨 Alerts
The script includes two built-in alert conditions:
• Bullish PinBar Detected
• Bearish PinBar Detected
These alerts can be paired with:
• TradingView notifications
• Webhooks (for bots / automation)
• Email or SMS alerts
⸻
🎯 Use Cases
• Identify high-probability reversal points
• Enhance price action strategies
• Combine with S/R zones, supply & demand, trendlines, or order blocks
• Filter entries on lower timeframes while following higher-timeframe trend bias
⸻
📘 Notes
This is a minimalistic version by design.
If you want a more advanced version (confirmation candle, volume filter, multi-timeframe filtering, trend direction filtering, etc.), this script can be expanded easily

智能趋势-多周期动态信号 Smart Trend Oscillator MTF V1🚀 智能趋势-多周期动态信号 Smart Trend Oscillator MTF V1
—— 让交易像红绿灯一样简单直观 | Making Trading as Simple as Traffic Lights
告别复杂的参数设置,把市场噪音变成明确的信号。 Say goodbye to complex parameters. Turn market noise into clear signals.
🌟 它是做什么的? / What Does It Do?
“智能趋势管家” 就像您的私人交易副驾驶。它内置了一套先进的智能平滑算法,能够自动过滤掉市场中那些骗人的假动作,只把最核心的**“市场真实韵律”通过一条平滑的波浪线展示给您。它不只是一根线,它是一套会思考的系统**。
"Smart Trend Oscillator " is like your personal trading co-pilot. It features a built-in advanced smoothing algorithm that automatically filters out deceptive market "fake-outs," revealing the "true rhythm" of the market through a single, smooth wave. It’s not just a line; it’s a thinking system.
🔥 核心功能 / Core Features
1. 🌊 智能波浪引擎 / Smart Wave Engine
不要被K线的上蹿下跳迷惑。我们的引擎能识别市场内部的真实能量。 Don't be confused by erratic candlesticks. Our engine identifies the true internal energy of the market.
过滤噪音 (Filter Noise):自动忽略短暂的随机波动。
捕捉趋势 (Capture Trends):波浪上升代表买方主导,波浪下降代表卖方主导。
2. 🛡️ 自适应波动通道 / Adaptive Channels
市场有时候像乌龟(波动小),有时候像兔子(波动大)。指标拥有一个“弹性通道”,它会根据市场活跃度自动变宽或变窄,精准判断价格是否“过热”或“超卖”。 The market moves between low and high volatility. The indicator features an "elastic channel" that automatically widens or narrows, accurately judging if the price is "Overheated" or "Oversold."
3. 🌍 全局监控面板 / Global Dashboard
右上角的面板是您的战况指挥室。一眼看懂 6 个不同时间维度的状态。全绿代表多周期共振向上,全红代表多周期共振向下。 The panel in the top-right corner is your Command Center. Understand the status of 6 different time dimensions at a glance. All Green means upward resonance; All Red means downward resonance.
⚙️ 极致的个性化定制 / Ultimate Customization
v16 版本为您提供了前所未有的控制权,让指标完全适应您的交易风格。 Version 16 gives you unprecedented control to tailor the indicator to your trading style.
🕒 1. 时间周期,由你定义 (Customizable Timeframes)
不再局限于系统默认设置。您可以在设置面板中自由输入 6 个您最关心的周期(例如:5分钟、1小时、甚至 3天)。
短线手:设置为 1分/3分/5分/15分...
波段手:设置为 1小时/4小时/日线/周线...
Benefit: You can freely input the 6 timeframes that matter most to you in the settings panel, whether you are a scalper or a swing trader.
🎯 2. 灵敏度调节 (Adjustable Sensitivity)
想要更多交易机会?还是想要更稳健的信号?
高灵敏度:调高 Zone Sensitivity,捕捉每一次微小的回调(适合激进风格)。
低灵敏度:调低数值,过滤掉小波动,只抓大趋势(适合稳健风格)。
Benefit: Dial up the sensitivity to catch every minor pullback (Aggressive), or dial it down to filter noise and catch only big trends (Conservative).
📊 3. 两种平滑模式 (SMA vs. VWMA)
您可以选择通道的计算核心:
Standard (SMA):经典模式,适合大多数市场。
Volume Weighted (VWMA):成交量加权模式。在加密货币或股票市场,它能帮您过滤掉“无量空涨”或“无量空跌”的假信号。
Benefit: Choose Standard (SMA) for general markets, or Volume Weighted (VWMA) to filter out fake moves on low volume (great for Crypto/Stocks).
🚦 信号含义 / Signals Guide
我们把复杂的逻辑浓缩成了最简单的视觉标签: We have condensed complex logic into the simplest visual labels:
🟢 绿色 BUY 标签:市场“便宜”且能量向上。 (Market is "Cheap" & Energy is Up.)
🔴 红色 SELL 标签:市场“过热”且能量向下。 (Market is "Overheated" & Energy is Down.)
🔵 蓝色 HOLD 标签:趋势延续中,建议持仓。 (Trend is continuing, suggest holding position.)
📥 快速上手 / Quick Start
加载指标 (Load):添加到您的图表。
设置周期 (Set Timeframes):在输入选项里填入您习惯查看的 6 个时间周期。
选择模式 (Choose Mode):如果是成交量重要的资产,建议开启 VWMA 模式。
等信号 (Wait):等待带方框的 BUY 或 SELL 标签出现。
把复杂留给算法,把简单留给您。 Leave the complexity to the algorithms, and keep the simplicity for yourself.


Multi-EMA Slope DashboardThis script provides a comprehensive dashboard displayed directly on the chart, allowing you to analyze the underlying trend using 8 Exponential Moving Averages (EMA) ranging from period 20 to 55.
Unlike classic indicators that simply check if the price is above or below the EMA, this tool analyzes the slope of each moving average to determine the true market dynamics.
The indicator calculates the status of 8 distinct EMAs (20, 25, 30, 35, 40, 45, 50, 55). For each EMA, the script determines the direction using the following logic:
Slope Calculation: It compares the current EMA value with its value 3 bars ago (variable nb_bougies).
Neutrality Threshold: To avoid false signals in ranging (flat) markets, a neutrality filter is applied (0.01% of the EMA value).
Dashboard Interpretation
The table is located at the top right of your screen and displays three columns:
EMA: The moving average period (e.g., 20, 55).
State:
H (Hausse / Up): The slope is positive and above the threshold.
B (Baisse / Down): The slope is negative and below the negative threshold.
N (Neutre / Neutral): The slope is weak, indicating no clear trend.
COL (Color): Quick visual indicator.
🔵 Blue: Bullish trend.
🟠 Orange: Bearish trend.
⚪ Gray: Neutral Trend / Ranging.
Trading Usage
Trend Confirmation: Use the "Totaux" (Totals) counter at the bottom of the table. If you see 8/8 H (Blue), the bullish trend is strong and aligned across all timeframes (short and medium term).
Reversal Detection: If fast EMAs (20, 25) turn Orange (B) while slow ones (50, 55) are still Blue (H), this may signal the beginning of a correction or a trend reversal.

FVG Theory - MTFThe indicator displays FVGs and Swings from different timeframes and marks the resistance!
Components:
Swings:
A swing is a 3-candle formation based on the Williams Fractal Indicator.
The interaction with the last swing is always displayed as a red line. This allows you to recognize the last interaction directly and draw conclusions about the further course of the price (sweep / break).
In addition, the closest fractal is always shown as a green line, which acts as a potential target.
2. FVGs:
FVGs are also known as Inbalance, it is a 3 candle formation where a gap is created in the market. The market often runs into this and reacts.
Theory:
When the weekly timeframe creates an bullish FVG, the market often reacts to it and reaches the high.
However, resistance must also be taken into account: this is the FVG that has not yet been reached and is in a higher timeframe than the entry.
For example: we have a weekly FVG as context and are trading in H4.
If an open daily FVG is against us in this way, it is marked as resistance.
The market must first react to this in H4 and break this resistance high for a good trade setup!
That is why the indicator shows the FVGs from the different timeframes, displaying the last reaction as well as the closest FVG that is still open.
The same applies if you take everything one timeframe lower: e.g. daily, H4 and H1.
You can easily set the different timeframes in the indicator.
Here we have a daily context, an H4 resistance (FVG against us) and the H1 structure!
Higher FVG are stronger!
If, for example, we follow the H4 FVG and a daily FVG forms below us, it is more likely that the market will take the larger FVG. This is always shown with the indicator!
Structure:
Overlaps are drawn when the new FVG overlaps with the structure (body or wick).
The FVG has differnt codes!
FVG codes:
↑ = bullish FVG
↓ = bearish FVG
↑↑ = breakaway gaps --> close of the third candle is above the second candle
↓↓ = breakaway gaps --> close of the third candle is below the second candle
❗ = 3rd candle of the FVG has already reacted deeply into the potential FVG!
🔪 = Sharp Turn --> FVG is taken out from the new FVG in the other direction!
🔥 = Order flow (reaction from previous FVG)
🚀 = 2CR --> reaction high/low from previous FVG is run down with FVG!
Indicator settings:
You can set the FVGs, overlaps, and swings in up to 4 different timeframes. You can switch these on and off, as well as change all colours!
The highest timeframe has the additional function of displaying the context (last fractal high and low from the current FVG).

FOR CRT SMT – 4 CANDLEFOR CRT SMT – 4 CANDLE Indicator
This indicator detects SMT (Smart Money Technique) divergence by comparing the last 4 candle highs and lows of two different assets.
Originally designed for BTC–ETH comparison, but it works on any market, including Forex pairs.
You can open EURUSD on the chart and select GBPUSD from the settings, and the indicator will detect SMT divergence between EUR and GBP the same way it does between BTC and ETH. This makes it useful for analyzing correlated markets across crypto, forex, and more.
🔴 Upper SMT (Bearish Divergence – Red)
Occurs when:
The main chart asset makes a higher high,
The comparison asset makes a lower high.
This may signal a liquidity grab and potential reversal.
🟢 Lower SMT (Bullish Divergence – Green)
Occurs when:
The main chart asset makes a lower low,
The comparison asset makes a higher low.
This may indicate the market is sweeping liquidity before reversing upward.
📌 Features
Uses the last 4 candles of both assets.
Automatically draws divergence lines.
Shows clear “SMT ↑” or “SMT ↓” labels.
Works on Crypto, Forex, and all correlated assets.

Trend Finder - Buy/Sell (Anuj Edition)Renko Trend Finder – Anuj Edition is a powerful trend-following tool designed to detect market direction using Renko logic instead of traditional candlesticks.
Renko filtering removes market noise, making trends clearer and reversals easier to identify.
This indicator internally builds Renko-style price movement and generates clean, high-quality Buy and Sell signals without repainting.

3 EMA TRONG 1-NTT CAPITALThe 3 EMA in 1 NTT CAPITAL indicator provides an overview of the market trend with three EMAs of different periods, helping to identify entry and exit points more accurately, thus supporting traders in making quick and effective decisions.

Master Indicator (Sessões + DWM + Lookback)Developed to track sessions in Asia, London, and New York.
With it, you can track the highs and lows of the sessions, as well as their captures.
You will also be able to view the highs and lows of days, weeks, and months in as many periods as you want.
All functions can be viewed in specific timeframes; adjust as needed for your trading strategy.
Finally, you will also have the option to configure midnight open and true day open.

LeO Nam - Thỏ TraderHello everyone, this indicator is designed to help you fight across all battlefields with a minimum win rate of 70% or higher. It can be used on multiple timeframes and delivers the highest efficiency on the M5 and M15 timeframes, which currently offer the best win-rate performance.
The indicator already includes full TP/SL levels — you simply need to follow the signals.
Note: When using the AE indicator, you must strictly follow the trading rules, enter only at valid breakout signals, set proper TP/SL, and apply proper risk management. Absolutely do NOT go all-in.

Options Scalper v2 - SPY/QQQHere's a comprehensive description of the Options Scalper v2 strategy:
---
## Options Scalper v2 - SPY/QQQ
### Overview
A multi-indicator confluence-based scalping strategy designed for trading SPY and QQQ options on short timeframes (1-5 minute charts). The strategy uses a scoring system to generate high-probability CALL and PUT signals by requiring alignment across multiple technical indicators before triggering entries.
---
### Core Logic
The strategy operates on a **scoring system (0-9 points)** where both bullish (CALL) and bearish (PUT) conditions are evaluated independently. A signal only fires when:
1. A recent EMA crossover occurred (within the last 3 bars)
2. The direction's score meets the minimum threshold (default: 4 points)
3. The signal's score is higher than the opposite direction
4. Enough bars have passed since the last signal (cooldown period)
5. Price action occurs during valid trading sessions
---
### Indicators Used
| Indicator | Purpose | CALL Condition | PUT Condition |
|-----------|---------|----------------|---------------|
| **9/21 EMA Cross** | Primary trigger | Fast EMA crosses above slow | Fast EMA crosses below slow |
| **200 EMA** | Trend filter | Price above 200 EMA | Price below 200 EMA |
| **RSI (14)** | Momentum filter | RSI between 45-65 | RSI between 35-55 |
| **VWAP** | Institutional level | Price above VWAP | Price below VWAP |
| **MACD (12,26,9)** | Momentum confirmation | MACD line > Signal line | MACD line < Signal line |
| **Stochastic (14,3)** | Overbought/Oversold | Oversold or K > D | Overbought or K < D |
| **Volume** | Participation confirmation | Spike on green candle | Spike on red candle |
| **Price Structure** | Breakout detection | Higher high formed | Lower low formed |
---
### Scoring Breakdown
**CALL Score (Max 9 points):**
- Recent EMA cross up: +2 pts
- EMA alignment (fast > slow): +1 pt
- RSI in bullish range: +1 pt
- Above VWAP: +1 pt
- MACD bullish: +1 pt
- Volume spike on green candle: +1 pt
- Stochastic setup: +1 pt
- Above 200 EMA: +1 pt
- Breaking higher high: +1 pt
**PUT Score (Max 9 points):**
- Recent EMA cross down: +2 pts
- EMA alignment (fast < slow): +1 pt
- RSI in bearish range: +1 pt
- Below VWAP: +1 pt
- MACD bearish: +1 pt
- Volume spike on red candle: +1 pt
- Stochastic setup: +1 pt
- Below 200 EMA: +1 pt
- Breaking lower low: +1 pt
---
### Risk Management
The strategy uses **ATR-based dynamic stops and targets**:
| Parameter | Default | Description |
|-----------|---------|-------------|
| Stop Loss | 1.5x ATR | Distance below entry for longs, above for shorts |
| Take Profit | 2.0x ATR | Creates a 1:1.33 risk-reward ratio |
Positions are also closed on:
- Opposite direction signal (flip trade)
- Take profit or stop loss hit
---
### Session Filtering
Trades are restricted to high-liquidity periods by default:
- **Morning Session:** 9:30 AM - 11:00 AM EST
- **Afternoon Session:** 2:30 PM - 3:55 PM EST
This avoids choppy midday price action and captures the highest volume periods.
---
### Input Parameters
| Parameter | Default | Description |
|-----------|---------|-------------|
| Fast EMA | 9 | Fast moving average period |
| Slow EMA | 21 | Slow moving average period |
| Trend EMA | 200 | Long-term trend filter |
| RSI Length | 14 | RSI calculation period |
| RSI Overbought | 65 | Upper RSI threshold |
| RSI Oversold | 35 | Lower RSI threshold |
| Volume Multiplier | 1.2x | Volume spike detection threshold |
| Min Signal Strength | 4 | Minimum score required to trigger |
| Crossover Lookback | 3 | Bars to consider crossover "recent" |
| Min Bars Between Signals | 5 | Cooldown period between signals |
---
### Visual Elements
**Chart Plots:**
- Green line: 9 EMA (fast)
- Red line: 21 EMA (slow)
- Gray line: 200 EMA (trend)
- Purple dots: VWAP
**Signal Markers:**
- Green triangle up + "CALL" label: Buy call signal
- Red triangle down + "PUT" label: Buy put signal
- Small circles: EMA crossover reference points
**Info Table (Top Right):**
- Real-time CALL and PUT scores
- RSI, MACD, Stochastic values
- VWAP and 200 EMA position
- Recent crossover status
- Current signal state
---
### Alerts
| Alert Name | Trigger |
|------------|---------|
| CALL Entry | Standard call signal fires |
| PUT Entry | Standard put signal fires |
| Strong CALL | Call signal with score ≥ 6 |
| Strong PUT | Put signal with score ≥ 6 |
---
### Recommended Usage
| Setting | 0DTE Scalping | Intraday Swings |
|---------|---------------|-----------------|
| Timeframe | 1-2 min | 5 min |
| Min Signal Strength | 5-6 | 4 |
| ATR Stop Mult | 1.0 | 1.5 |
| ATR TP Mult | 1.5 | 2.0 |
| Option Delta | 0.40-0.50 | 0.30-0.40 |
---
### Key Improvements Over v1
1. **Requires actual crossover** - Eliminates false signals from simple trend continuation
2. **Balanced scoring** - Both directions evaluated equally, highest score wins
3. **Signal cooldown** - Prevents overtrading with minimum bar spacing
4. **Multi-indicator confluence** - 8 factors must align for signal generation
5. **Volume-candle alignment** - Volume spikes only count when matching candle direction
---
### Disclaimer
This strategy is for educational purposes. Backtest thoroughly before live trading. Options trading involves significant risk of loss. Past performance does not guarantee future results.

Evergito HH/LL 3 Señales + ATR SLHow to trade with the Evergito HH/LL 3 Signals + ATR SL indicator? Brief and direct explanation: General system logic: The indicator looks for actual breakouts of the high/low of the last 20 bars (HH/LL) and combines them with the position relative to the 200 SMA to filter the underlying trend. You have 3 types of signals that you can activate/deactivate separately: Signal
When it appears
What it means in practice
Entry type
V1
HH breakout + the close crosses above the 200 SMA (or the opposite in a short position)
Very safe entry confirmed. The price has just validated the long/flat trend → safer and with a better ratio
The most reliable (the original)
V2
HH breakout but the price was already above the 200 SMA (or already below in a short position)
Entry in an already established trend. Fewer “surprises”, more continuity
Ideal for strong trends
V3
Only the breakout of the HH or LL, without looking at the 200 SMA
Aggressive entry/scalping on explosive breakouts. More signals, more noise.
For times of high volatility.
How to enter the market (simple rule): Wait for any of the 3 labels (V1, V2, or V3) to appear, depending on which ones you have activated.
Enter at the close of that candle (or at the open of the next one if you are conservative).
Automatic Stop Loss → the blue (long) or yellow (short) line that represents the ATR x2.
Take Profit → you decide, but the indicator already gives you the visual reference for the risk (ATR x2), so 1:2 or 1:3 is usually very convenient.
Practical example: You see a large green label “HH LONG V1” → you go long at the close of that candle. Stop right at the blue line (ATR x2 below the price).
Typical target: 2x or 3x the risk (very common to reach it in a trend).
Recommended use: Most traders leave only V1 activated → fewer signals but very high quality.
Those who trade intraday or crypto usually combine V1 + V2.
V3 only for news events or very volatile openings.
In summary:
Label = immediate entry
Blue/yellow line = automatic stop
And enjoy the move.

VietNguyen Buy_Sell VIPThis is indicator of Vietnammes, it is very good for trade Gold and Crypto.
Cre by: VietNguyenDN

Мой скриптinputs:
window(1),
type(0), // 0: close, 1: high low, 2: fractals up down, 3: new fractals
persistent(False),
exittype(1),
nbars(160),
adxthres(40),
nstop(3000);
vars:
currentSwingLow(0),
currentSwingHigh(0),
trailStructureValid(false),
downFractal(0),
upFractal(0),
breakStructureHigh(0),
breakStructureLow(0),
BoS_H(0),
BoS_L(0),
Regime(0),
Last_BoS_L(0),
Last_BoS_H(0),
PeakfilterX(false);
BoS(window,persistent,type,Bos_H,BoS_L,upFractal,downFractal,breakStructureHigh,breakStructureLow);
//BOS Regime
If BoS_H <> 0 then begin
Regime = 1; // Bullish
Last_BoS_H = BoS_H ;
end;
If BoS_L <> 0 Then begin
Regime = -1; // Bearish
Last_BoS_L = BoS_L ;
end;
//Entry Logic: if we are in BoS regime then wait for break swing to entry
if ADX(5) of data2 < adxthres then begin
if time>900 and Regime = 1 and EntriesToday(date)= 0 and Last_BoS_H upFractal then buy next bar at market;
end;
if time>900 and EntriesToday(date)= 0 and Regime = -1 and Last_BoS_L>downFractal then
begin
if close < downFractal then sellshort next bar at market;
end;
end;
// Exits: nbars or stoploss or at the end of the day
if marketposition <> 0 and barssinceentry >nbars then begin
sell next bar at market;
buytocover next bar at market;
end;
setstoploss(nstop);
setexitonclose;

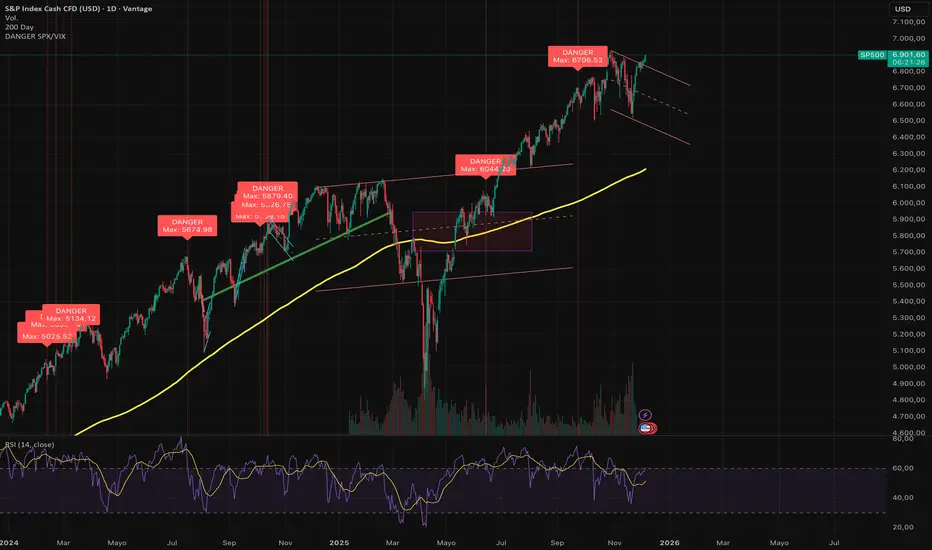
DANGER SP500This indicator is designed to identify severe correlation anomalies between the Volatility Index (VIX) and the S&P 500 (SPX). It operates on the premise that a simultaneous rise in both assets often precedes market corrections or significant local tops.
The underlying concept is "fear in the rally": investors are buying equities (driving price up), but at the same time, they are aggressively buying protection (Puts), causing the VIX to spike.
⚠️ Strict Usage Rules
To guarantee the mathematical reliability of the VIX data, this indicator includes strict security restrictions:
EXCLUSIVE ASSET: Designed solely for the S&P 500 (SPX, SPY, US500, ES1!). It should not be used on Crypto or Forex, as the VIX correlation does not apply in the same way.
LOCKED TIMEFRAME: It only functions on the Daily Chart (1D).
Note: The script includes a runtime.error block that will prevent execution if you attempt to load it on intraday charts (H1, H4, etc.) to avoid false signals caused by market noise.
Visualization
Red Background: Visually highlights the exact moment the alert is triggered.
"DANGER" Label: Prints clearly above the signaled bar.
Max Price Display: Unlike other indicators that mark the close, this tool specifically labels the HIGH of the candle, allowing you to identify the exact point of price extension.
🔔 Alerts
The script is ready for TradingView Alerts. The alert message is dynamic and will include the exact High price reached during the signal candle.
Disclaimer: This script is for technical analysis purposes only and does not constitute financial advice. Trading involves risk.
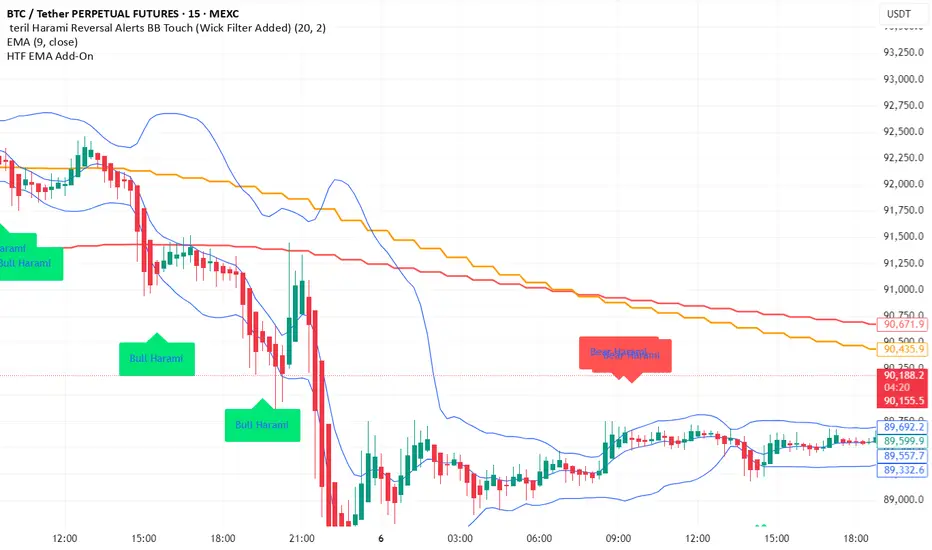
teril Harami Reversal Alerts BB Touch (Wick Filter Added) teril Harami Reversal Alerts BB Touch (Wick Filter Added)
teril Harami Reversal Alerts BB Touch (Wick Filter Added) teril Harami Reversal Alerts BB Touch (Wick Filter Added) teril Harami Reversal Alerts BB Touch (Wick Filter Added)
teril Harami Reversal Alerts BB Touch (Wick Filter Added)
