SCTI-D1SCTI-D1 Indicator Introduction / 指标简介
The SCTI-D1 (Smart Composite Trading Indicator - Daily) is a comprehensive, multi-feature trading tool designed for serious traders who demand depth, flexibility, and clarity in their market analysis. This indicator combines several powerful concepts into one seamless workflow, including:
Multiple EMA Systems with customizable lengths and visibility
PMA (Projected Moving Average) with fill options between lines
VWAP with configurable anchors and deviation bands
Divergence Detection for MACD and Histogram
Volume Profile with node detection (peaks, troughs, highs, lows)
Smart Money Concepts including order blocks, fair value gaps, equal highs/lows, and market structure shifts
Whether you trade stocks, forex, or cryptocurrencies, the SCTI-D1 helps you identify key levels, track institutional activity, and spot high-probability reversal signals—all in one clean, customizable interface.
SCTI-D1 指标简介
SCTI-D1(智能综合交易指标 - 日线版)是一款功能全面的交易工具,专为需要深度、灵活性和清晰市场分析的专业交易者设计。该指标将多种强大概念融合在一个流畅的工作流程中,包括:
多组EMA系统,可自定义长度和显示
PMA(投影移动平均线),支持均线间填充色
VWAP,可配置锚定周期和偏差带
背离检测,支持MACD和柱状图
成交量分布,支持节点检测(峰值、谷值、最高、最低)
聪明钱概念,包括订单块、公允价值缺口、等高/等低和市场结构转换
无论您交易股票、外汇还是加密货币,SCTI-D1 都能帮助您识别关键水平、跟踪机构资金动向并发现高概率反转信号——所有功能均集成在一个清晰可定制的界面中。
밴드 및 채널

Ichimoku Trading Signals 2Swing Trading (Strategy 1, H4+ timeframes)
Use the Kumo Cloud to identify the trend: price above a green cloud = uptrend; price below a red cloud = downtrend.
Entry signals occur when price or the Tenkan-sen line crosses the Kijun-sen line, confirmed by Chikou Span momentum.
Exit triggers when price crosses back through the Kijun-sen or when Tenkan-sen crosses back below (for long positions) or above (for short positions).
Place stop-loss orders just beyond the nearest swing low/high candle cluster to manage risk tightly.

PDH/PDL (prev RTH) + Current ETH High/LowDescription:
This indicator automatically plots the key levels of PDH/PDL (Previous Day High/Low from regular trading hours – RTH) and ETH High/Low (Extended Hours: pre-market + after-hours) in real time.
• PDH/PDL: calculated at the close of RTH (09:30–16:00 NYSE) and anchored until the next day.
• ETH High/Low: updated live during extended hours (04:00–09:29 and 16:00–20:00 NYSE) and “frozen” at the RTH open for reference during the regular session.
• Customization options: colors, line styles (solid/dashed/dotted), thickness, labels, and the ability to extend lines to the right.
• Levels can also be displayed directly on the price scale.
This script is designed for traders who want a quick visualization of the most relevant levels from the previous day and extended hours, making it easier to identify supports, resistances, and potential reaction zones in price action.
By: Miguel Arenas

Bitcoin cme gap indicators, BINANCE vs CME exchanges premium gap
# CME BTC Premium Indicator Documentation CME:BTC1!
## 1. Overview
Indicator Name: CME BTC Premium
Platform: TradingView (Pine Script v6)
Type: Premium / Gap Analysis
Purpose:
* Visualize the CME BTC futures premium/discount relative to Binance BTCUSDT spot price.
* Detect gap-up or gap-down events on the daily chart.
* Assess short-term market sentiment and potential volatility through price discrepancies.
## 2. Key Features
1. CME Premium Calculation
* Formula:
CME Premium(%) = ((CME Price - Binance Price) / Binance Price) X 100
* Positive premium: CME futures are higher than spot → Color: Blue
* Negative premium: CME futures are lower than spot → Color: Purple
2. Premium Visualization Options
* `Column` (default)
* `Line`
3. Daily Gap Detection (Daily Chart Only)
* Gap Up: CME open > previous high × 1.0001 (≥ 0.01%)
* Gap Down: CME open < previous low × 0.9999 (≤ 0.01%)
* Visualization:
* Bar Color:
* Gap Up → Yellow (semi-transparent)
* Gap Down → Blue (semi-transparent)
* Background Color:
* Gap Up → Yellow (semi-transparent)
* Gap Down → Blue (semi-transparent)
4. Label Display
* If `Show CME Label` is enabled, the last bar displays a premium percentage label.
* Label color matches premium color; text color: Black.
* Style: `style_label_upper_left`, Size: `small`.
## 3. User Inputs
| Option Name | Description | Type / Default |
| -------------- | ------------------------- | --------------------------------------- |
| Show CME Label | Display CME premium label | Boolean / true |
| CME Plot Type | CME premium chart style | String / Column (Options: Column, Line) |
## 4. Data Sources
| Data Item | Symbol | Description |
| ------------- | ---------------- | ----------------------------- |
| Binance Price | BINANCE\:BTCUSDT | Spot BTC price |
| CME Price | CME\:BTC1! | CME BTC futures closing price |
| CME Open | CME\:BTC1! | CME BTC futures open price |
| CME Low | CME\:BTC1! | CME BTC futures low price |
| CME High | CME\:BTC1! | CME BTC futures high price |
## 5. Chart Display
1. Premium Column/Line
* Displays the CME premium percentage in real-time.
* Color: Premium ≥ 0 → Blue, Premium < 0 → Purple
2. Zero Line
* Indicates CME futures are at parity with spot for quick visual reference.
3. Gap Highlight
* Applied only on daily charts.
* Gap-up or gap-down is highlighted using bar and background colors.
4. Label
* Shows the latest CME premium percentage for quick monitoring.
## 6. Use Cases
* Analyze spot-futures premium to gauge CME market sentiment.
* Identify short-term volatility and potential trend reversals through daily gaps.
* Combine premium and gap analysis to support altcoin trend analysis and position strategy.
## 7. Limitations
* This indicator does not provide investment advice or trading recommendations; it is for informational purposes only.
* Data delays, API restrictions, or exchange differences may result in calculation discrepancies.
* Gap detection is meaningful only on daily charts; other timeframes may not provide valid signals.

BTC Evaluation IndicatorBTC Evaluation Indicator
The BTC Evaluation Indicator is a volatility-based tool designed to help traders evaluate Bitcoin’s price behavior relative to its moving average trend. It combines customizable moving averages with dynamic standard deviation bands to identify overbought and oversold conditions.
Key Features
Flexible Moving Averages: Choose between SMA, EMA, WMA, VWMA, HMA, or RMA for the baseline trend.
Dynamic Volatility Bands: Upper and lower bands are calculated using standard deviation, scaled by a user-defined multiplier.
Visual Clarity:
Orange line = central moving average (trend mean)
Green line = upper band (potential overbought zone)
Red line = lower band (potential oversold zone)
Shaded gray area = volatility range
Automatic Highlights: Background shading marks when price breaks above the upper band (overbought) or below the lower band (oversold).
How to Use
When price pushes above the upper band, it may indicate overextension or potential local overbought conditions.
When price falls below the lower band, it may signal undervaluation or potential oversold conditions.
The mean line acts as a dynamic equilibrium, often serving as short-term support/resistance.
This indicator is designed for Bitcoin evaluation, but it can be applied to any asset. By combining trend analysis with volatility context, it helps traders better understand when price may be stretched and when conditions are reverting to the mean.

RSI Dynamic Bands█ OVERVIEW
The "RSI Dynamic Bands" indicator is a variant of the Relative Strength Index (RSI) oscillator that brings its signals directly onto the price chart. It displays dynamic bands around the price, adjusted based on RSI levels, enabling easy identification of potential overbought or oversold conditions. The indicator also integrates a multi-timeframe RSI table, facilitating the analysis of trend strength across different timeframes.
█ CONCEPTS
The "RSI Dynamic Bands" indicator is designed to simplify the interpretation of price levels in the context of support and resistance zones, which can be correlated with other technical indicators and RSI values. Since the price itself does not display RSI values, a table showing RSI for four selected timeframes has been added, allowing traders to quickly assess trend strength across different time intervals. The most effective approach is to combine the indicator with other technical analysis tools, such as Fibonacci levels or pivot points, to confirm signals when the price approaches the bands and RSI values indicate a potential reversal.
Band Calculation
The bands are calculated based on the current closing price and RSI values, incorporating dynamic scaling to better adapt to market conditions. The formulas for the bands are as follows:
• Upper Band: close + (rsiUpper - rsi) * scaleFactor, where rsiUpper is the upper RSI level (default: 70), and scaleFactor accounts for market volatility.
• Lower Band: close + (rsiLower - rsi) * scaleFactor, where rsiLower is the lower RSI level (default: 30).
• Midline: The arithmetic average of the upper and lower bands: (upperBand + lowerBand) / 2.
Why Scaling? Without scaling, the bands would be chaotic and jagged, making them difficult to interpret. Scaling smooths the bands, making them wider during periods of high volatility and narrower during consolidation, better reflecting potential support and resistance levels.
Indicator Features
• Dynamic Price Bands: The bands adapt to market conditions, facilitating the identification of key price levels.
• Multi-Timeframe RSI Table: Displays RSI values for four selected timeframes (default: 15m, 1h, 4h, Daily), enabling comparison of trend strength across different perspectives.
• Style Customization: Users can adjust band colors, line thickness, and toggle the visibility of bands, fills, and the table.
How to Set Up the Indicator
1 — Add the "RSI Dynamic Bands" indicator to your TradingView chart.
2 — Configure parameters in the settings, such as RSI length, upper/lower levels, and scaling multiplier, to match your trading style.
3 — Enable or disable the display of bands, fills, or the RSI table based on your needs.
4 — Adjust band and table colors in the input section and line thickness in the "Style" section to better align the indicator with your chart.
█ OTHER SECTIONS
FEATURES
• RSI Length: The period for calculating RSI (default: 14).
• RSI Levels: Thresholds for overbought (default: 70) and oversold (default: 30).
• Scaling Multiplier: Adjusts bands based on market volatility (default: 0.15).
• Table Timeframes: Select four timeframes for the RSI table (default: 15m, 1h, 4h, Daily).
• Style Options: Customize band colors, fills, table, and line thickness.
HOW TO USE
Add the indicator to your chart, configure the parameters, and observe price interactions with the bands to identify potential entry and exit points. The RSI table allows you to compare RSI values across different timeframes, aiding in trading decisions. The most effective approach is to combine the indicator with other technical analysis tools, such as Fibonacci levels or pivot points, to confirm signals when the price approaches the bands and RSI values indicate a potential reversal.
Trading Strategies:
• Scalping: Use lower timeframes (e.g., 5m, 15m) in the RSI table to quickly identify short-term lows and highs. Wait for the price to approach the lower band in the RSI oversold zone, with RSI on lower timeframes starting to rise, and other tools, such as Fibonacci levels (e.g., 38.2%) or pivot points, confirming support.
• Medium-Term Trading: Focus on 1h and 4h timeframes. Look for confirmation of a low on a lower timeframe (e.g., 1h), where RSI indicates oversold conditions or starts rising, then check if RSI on a higher timeframe (e.g., 4h) confirms the trend. Confirmation from other tools, such as a Fibonacci level (e.g., 50%) or pivot point near the bands, strengthens the signal.
• Long-Term Trading: Use Daily and higher timeframes (e.g., Weekly). Wait for all relevant timeframes to confirm a low (e.g., RSI near oversold and price at the lower band), with lower timeframes (e.g., 4h) showing rising RSI. Other tools, such as Fibonacci levels (e.g., 61.8%) or pivot points near the bands, can further confirm a trend reversal signal.

Pure Price Zone Flow🔎 What this indicator is
It’s a price-action-based zone indicator. Unlike moving average systems, this one relies only on:
1. Swing Highs & Swing Lows → The highest and lowest points within a recent lookback period (like "mini support & resistance").
2. ATR (Average True Range) → A volatility measure that expands the zone, making it more adaptive to different market conditions.
3. Breakouts & Retests → When price breaks above a swing high (bullish) or below a swing low (bearish), the indicator marks it and highlights the new trend.
👉 The goal is to spot clean structure shifts and define clear trend zones where traders can position themselves.
________________________________________
⚙️ How it is calculated
1. Swing High & Swing Low
o We look back len candles (default 20).
o Find the highest high (swingHigh) and the lowest low (swingLow) in that window.
o This forms the price range zone.
2. ATR Expansion
o We calculate ATR over the same len.
o Add/subtract it (multiplied by atrMult) to the zone edges to expand them.
o This ensures the zones breathe with volatility (tight in quiet markets, wide in choppy ones).
3. Mid-Zone
o Simply the average of swingHigh and swingLow.
o If price is above mid → bullish bias.
o If below mid → bearish bias.
o This gives us the trend color for candles.
4. Breakouts
o If the close crosses above swingHigh, we mark a bullish breakout with a label.
o If the close crosses below swingLow, we mark a bearish breakdown.
________________________________________
📊 How it helps traders
This indicator helps by:
1. Identifying Structure Shifts
o Many traders watch swing highs/lows for breakouts or reversals.
o This automates the process and visually confirms when structure is broken.
2. Dynamic Zone Trading
o Instead of fixed support/resistance, the ATR expansion adapts to volatility.
o This avoids false signals in high-volatility conditions.
3. Trend Bias at a Glance
o Candle coloring instantly tells you whether price is in bullish or bearish territory relative to the mid-zone.
4. Breakout Confirmation
o The labels show when a breakout has occurred, so traders can react quickly (e.g., enter with trend, wait for retest, or avoid fading moves).
________________________________________
🌍 Markets it works best in
• Crypto (Bitcoin, Ethereum, etc.): Very effective since crypto is breakout-driven and respects swing levels.
• Forex: Good for volatility-adaptive structure analysis, especially in trending pairs.
• Indices (SPX, NASDAQ, DAX, NIFTY): Useful for breakout trading during session opens or key news events.
• Commodities (Gold, Oil, Silver): Works well to define intraday ranges and breakout levels.
⚠️ Less useful in low-volatility, mean-reverting assets (like some penny stocks or sideways ranges), because breakouts may be rare or fake.
________________________________________
💡 How it adds value
• Strips away unnecessary complexity (no lagging averages).
• Focuses directly on what price is doing structurally.
• Adaptive → works across different markets & timeframes.
• Easy visualization → zones, trend coloring, breakout markers.
• Helps traders trade with the flow of the market, instead of guessing tops/bottoms.
________________________________________
👉 In short:
This indicator turns raw price action into clear, actionable zones.
It highlights when the market shifts from balance to breakout, so traders can align with momentum rather than fighting it.

Deviation from Mid MA5 & MA10 (%)Title:
Deviation from Mid-Price MA5 & MA10 (%)
Description:
This script calculates and displays the percentage deviation of the current mid-price from its 5-day and 10-day simple moving averages.
The mid-price is defined as the average of the open and close prices: (Open + Close) / 2
Instead of relying on traditional close-based MAs, this version uses mid-price to better reflect actual price flow by incorporating both the opening and closing values.
Main features:
Displays % deviation from both 5-day and 10-day mid-price moving averages
Better alignment with intraday reality due to gap-sensitive mid-price base
Smooths out erratic closing spikes for clearer signals
Helps identify overextended moves and potential pullback zones
Included lines:
Deviation from 5-day Mid MA
Deviation from 10-day Mid MA
Zero baseline for reference
Recommended for:
Traders seeking a cleaner measure of price deviation
Short-term pullback or re-entry strategy users
Anyone analyzing steady, low-volatility uptrends

Multi-Band Trend LineThis Pine Script creates a versatile technical indicator called "Multi-Band Trend Line" that builds upon the concept of the popular "Follow Line Indicator" by Dreadblitz. While the original Follow Line Indicator uses simple trend detection to place a line at High or Low levels, this enhanced version combines multiple band-based trading strategies with dynamic trend line generation. The indicator supports five different band types and provides more sophisticated buy/sell signals based on price breakouts from various technical analysis bands.
Key Features
Multi-Band Support
The indicator supports five different band types:
- Bollinger Bands: Uses standard deviation to create bands around a moving average
- Keltner Channels: Uses ATR (Average True Range) to create bands around a moving average
- Donchian Channels: Uses the highest high and lowest low over a specified period
- Moving Average Envelopes: Creates bands as a percentage above and below a moving average
- ATR Bands: Uses ATR multiplier to create bands around a moving average
Dynamic Trend Line Generation (Enhanced Follow Line Concept)
- Similar to the Follow Line Indicator, the trend line is placed at High or Low levels based on trend direction
- Key Enhancement: Instead of simple trend detection, this version uses band breakouts to trigger trend changes
- When price breaks above the upper band (bullish signal), the trend line is set to the low (optionally adjusted with ATR) - similar to Follow Line's low placement
- When price breaks below the lower band (bearish signal), the trend line is set to the high (optionally adjusted with ATR) - similar to Follow Line's high placement
- The trend line acts as dynamic support/resistance, following the price action more precisely than the original Follow Line
ATR Filter (Follow Line Enhancement)
- Like the original Follow Line Indicator, an ATR filter can be selected to place the line at a more distance level than the normal mode settled at candles Highs/Lows
- When enabled, it adds/subtracts ATR value to provide more conservative trend line placement
- Helps reduce false signals in volatile markets
- This feature maintains the core philosophy of the Follow Line while adding more precision through band-based triggers
Signal Generation
- Buy Signal: Generated when trend changes from bearish to bullish (trend line starts rising)
- Sell Signal: Generated when trend changes from bullish to bearish (trend line starts falling)
- Signals are displayed as labels on the chart
Visual Elements
- Upper and lower bands are plotted in gray
- Trend line changes color based on direction (green for bullish, red for bearish)
- Background color changes based on trend direction
- Buy/sell signals are marked with labeled shapes
How It Works
Band Calculation: Based on the selected band type, upper and lower boundaries are calculated
Signal Detection: When price closes above the upper band or below the lower band, a breakout signal is generated
Trend Line Update: The trend line is updated based on the breakout direction and previous trend line value
Trend Direction: Determined by comparing current trend line with the previous value
Alert Generation: Buy/sell conditions trigger alerts and visual signals
Use Cases
Enhanced trend following strategies: More precise than basic Follow Line due to band-based triggers
Breakout trading: Multiple band types provide various breakout opportunities
Dynamic support/resistance identification: Combines Follow Line concept with band analysis
Multi-timeframe analysis with different band types: Choose the most suitable band for your timeframe
Reduced false signals: Band confirmation provides better entry/exit points compared to simple trend following

CNS - Multi-Timeframe Bollinger Band OscillatorMy hope is to optimize the settings for this indicator and reintroduce it as a "strategy" with suggested position entry and exit points shown in the price pane.
I’ve been having good results setting the “Bollinger Band MA Length” in the Input tab to between 5 and 10. You can use the standard 20 period, but your results will not be as granular.
This indicator has proven very good at finding local tops and bottoms by combining data from multiple timeframes. Use BB timeframes that are lower than the timeframe you are viewing in your price pane.
The default settings work best on the weekly timeframe, but can be adjusted for most timeframes including intraday.
Be cognizant that the indicator, like other oscillators, does occasionally produce divergences at tops and bottoms.
Any feedback is appreciated.
Overview
This indicator is an oscillator that measures the normalized position of the price relative to Bollinger Bands across multiple timeframes. It takes the price's position within the Bollinger Bands (calculated on different timeframes) and averages those positions to create a single value that oscillates between 0 and 1. This value is then plotted as the oscillator, with reference lines and colored regions to help interpret the price's relative strength or weakness.
How It Works
Bollinger Band Calculation:
The indicator uses a custom function f_getBBPosition() to calculate the position of the price within Bollinger Bands for a given timeframe.
Price Position Normalization:
For each timeframe, the function normalizes the price's position between the upper and lower Bollinger Bands.
It calculates three positions based on the high, low, and close prices of the requested timeframe:
pos_high = (High - Lower Band) / (Upper Band - Lower Band)
pos_low = (Low - Lower Band) / (Upper Band - Lower Band)
pos_close = (Close - Lower Band) / (Upper Band - Lower Band)
If the upper band is not greater than the lower band or if the data is invalid (e.g., na), it defaults to 0.5 (the midline).
The average of these three positions (avg_pos) represents the normalized position for that timeframe, ranging from 0 (at the lower band) to 1 (at the upper band).
Multi-Timeframe Averaging:
The indicator fetches Bollinger Band data from four customizable timeframes (default: 30min, 60min, 240min, daily) using request.security() with lookahead=barmerge.lookahead_on to get the latest available data.
It calculates the normalized position (pos1, pos2, pos3, pos4) for each timeframe using f_getBBPosition().
These four positions are then averaged to produce the final avg_position:avg_position = (pos1 + pos2 + pos3 + pos4) / 4
This average is the oscillator value, which is plotted and typically oscillates between 0 and 1.
Moving Averages:
Two optional moving averages (MA1 and MA2) of the avg_position can be enabled, calculated using simple moving averages (ta.sma) with customizable lengths (default: 5 and 10).
These can be potentially used for MA crossover strategies.
What Is Being Averaged?
The oscillator (avg_position) is the average of the normalized price positions within the Bollinger Bands across the four selected timeframes. Specifically:It averages the avg_pos values (pos1, pos2, pos3, pos4) calculated for each timeframe.
Each avg_pos is itself an average of the normalized positions of the high, low, and close prices relative to the Bollinger Bands for that timeframe.
This multi-timeframe averaging smooths out short-term fluctuations and provides a broader perspective on the price's position within the volatility bands.
Interpretation
0.0 The price is at or below the lower Bollinger Band across all timeframes (indicating potential oversold conditions).
0.15: A customizable level (green band) which can be used for exiting short positions or entering long positions.
0.5: The midline, where the price is at the average of the Bollinger Bands (neutral zone).
0.85: A customizable level (orange band) which can be used for exiting long positions or entering short positions.
1.0: The price is at or above the upper Bollinger Band across all timeframes (indicating potential overbought conditions).
The colored regions and moving averages (if enabled) help identify trends or crossovers for trading signals.
Example
If the 30min timeframe shows the close at the upper band (position = 1.0), the 60min at the midline (position = 0.5), the 240min at the lower band (position = 0.0), and the daily at the upper band (position = 1.0), the avg_position would be:(1.0 + 0.5 + 0.0 + 1.0) / 4 = 0.625
This value (0.625) would plot in the orange region (between 0.85 and 0.5), suggesting the price is relatively strong but not at an extreme.
Notes
The use of lookahead=barmerge.lookahead_on ensures the indicator uses the latest available data, making it more real-time, though its effectiveness depends on the chart timeframe and TradingView's data feed.
The indicator’s sensitivity can be adjusted by changing bb_length ("Bollinger Band MA Length" in the Input tab), bb_mult ("Bollinger Band Standard Deviation," also in the Input tab), or the selected timeframes.

Multi-Timeframe Bollinger BandsMy hope is to optimize the settings for this indicator and reintroduce it as a "strategy" with suggested position entry and exit points shown in the price pane.
I’ve been having good results setting the “Bollinger Band MA Length” in the Input tab to between 5 and 10. You can use the standard 20 period, but your results will not be as granular.
This indicator has proven very good at finding local tops and bottoms by combining data from multiple timeframes. Use timeframes that are lower than the timeframe you are viewing in your price pane. Be cognizant that the indicator, like other oscillators, does occasionally produce divergences at tops and bottoms.
Any feedback is appreciated.
Overview
This indicator is an oscillator that measures the normalized position of the price relative to Bollinger Bands across multiple timeframes. It takes the price's position within the Bollinger Bands (calculated on different timeframes) and averages those positions to create a single value that oscillates between 0 and 1. This value is then plotted as the oscillator, with reference lines and colored regions to help interpret the price's relative strength or weakness.
How It Works
Bollinger Band Calculation:
The indicator uses a custom function f_getBBPosition() to calculate the position of the price within Bollinger Bands for a given timeframe.
Price Position Normalization:
For each timeframe, the function normalizes the price's position between the upper and lower Bollinger Bands.
It calculates three positions based on the high, low, and close prices of the requested timeframe:
pos_high = (High - Lower Band) / (Upper Band - Lower Band)
pos_low = (Low - Lower Band) / (Upper Band - Lower Band)
pos_close = (Close - Lower Band) / (Upper Band - Lower Band)
If the upper band is not greater than the lower band or if the data is invalid (e.g., na), it defaults to 0.5 (the midline).
The average of these three positions (avg_pos) represents the normalized position for that timeframe, ranging from 0 (at the lower band) to 1 (at the upper band).
Multi-Timeframe Averaging:
The indicator fetches Bollinger Band data from four customizable timeframes (default: 30min, 60min, 240min, daily) using request.security() with lookahead=barmerge.lookahead_on to get the latest available data.
It calculates the normalized position (pos1, pos2, pos3, pos4) for each timeframe using f_getBBPosition().
These four positions are then averaged to produce the final avg_position:avg_position = (pos1 + pos2 + pos3 + pos4) / 4
This average is the oscillator value, which is plotted and typically oscillates between 0 and 1.
Moving Averages:
Two optional moving averages (MA1 and MA2) of the avg_position can be enabled, calculated using simple moving averages (ta.sma) with customizable lengths (default: 5 and 10).
These can be potentially used for MA crossover strategies.
What Is Being Averaged?
The oscillator (avg_position) is the average of the normalized price positions within the Bollinger Bands across the four selected timeframes. Specifically:It averages the avg_pos values (pos1, pos2, pos3, pos4) calculated for each timeframe.
Each avg_pos is itself an average of the normalized positions of the high, low, and close prices relative to the Bollinger Bands for that timeframe.
This multi-timeframe averaging smooths out short-term fluctuations and provides a broader perspective on the price's position within the volatility bands.
Interpretation
0.0 The price is at or below the lower Bollinger Band across all timeframes (indicating potential oversold conditions).
0.15: A customizable level (green band) which can be used for exiting short positions or entering long positions.
0.5: The midline, where the price is at the average of the Bollinger Bands (neutral zone).
0.85: A customizable level (orange band) which can be used for exiting long positions or entering short positions.
1.0: The price is at or above the upper Bollinger Band across all timeframes (indicating potential overbought conditions).
The colored regions and moving averages (if enabled) help identify trends or crossovers for trading signals.
Example
If the 30min timeframe shows the close at the upper band (position = 1.0), the 60min at the midline (position = 0.5), the 240min at the lower band (position = 0.0), and the daily at the upper band (position = 1.0), the avg_position would be:(1.0 + 0.5 + 0.0 + 1.0) / 4 = 0.625
This value (0.625) would plot in the orange region (between 0.85 and 0.5), suggesting the price is relatively strong but not at an extreme.
Notes
The use of lookahead=barmerge.lookahead_on ensures the indicator uses the latest available data, making it more real-time, though its effectiveness depends on the chart timeframe and TradingView's data feed.
The indicator’s sensitivity can be adjusted by changing bb_length ("Bollinger Band MA Length" in the Input tab), bb_mult ("Bollinger Band Standard Deviation," also in the Input tab), or the selected timeframes.

Multi-Timeframe Bollinger Band PositionBeta version.
My hope is to optimize the settings for this indicator and reintroduce it as a "strategy" with suggested position entry and exit points shown in the price pane.
Any feedback is appreciated.
Overview
This indicator is an oscillator that measures the normalized position of the price relative to Bollinger Bands across multiple timeframes. It takes the price's position within the Bollinger Bands (calculated on different timeframes) and averages those positions to create a single value that oscillates between 0 and 1. This value is then plotted as the oscillator, with reference lines and colored regions to help interpret the price's relative strength or weakness.
How It Works
Bollinger Band Calculation:
The indicator uses a custom function f_getBBPosition() to calculate the position of the price within Bollinger Bands for a given timeframe.
Price Position Normalization:
For each timeframe, the function normalizes the price's position between the upper and lower Bollinger Bands.
It calculates three positions based on the high, low, and close prices of the requested timeframe:
pos_high = (High - Lower Band) / (Upper Band - Lower Band)
pos_low = (Low - Lower Band) / (Upper Band - Lower Band)
pos_close = (Close - Lower Band) / (Upper Band - Lower Band)
If the upper band is not greater than the lower band or if the data is invalid (e.g., na), it defaults to 0.5 (the midline).
The average of these three positions (avg_pos) represents the normalized position for that timeframe, ranging from 0 (at the lower band) to 1 (at the upper band).
Multi-Timeframe Averaging:
The indicator fetches Bollinger Band data from four customizable timeframes (default: 30min, 60min, 240min, daily) using request.security() with lookahead=barmerge.lookahead_on to get the latest available data.
It calculates the normalized position (pos1, pos2, pos3, pos4) for each timeframe using f_getBBPosition().
These four positions are then averaged to produce the final avg_position:avg_position = (pos1 + pos2 + pos3 + pos4) / 4
This average is the oscillator value, which is plotted and typically oscillates between 0 and 1.
Moving Averages:
Two optional moving averages (MA1 and MA2) of the avg_position can be enabled, calculated using simple moving averages (ta.sma) with customizable lengths (default: 5 and 10).
These can be potentially used for MA crossover strategies.
What Is Being Averaged?
The oscillator (avg_position) is the average of the normalized price positions within the Bollinger Bands across the four selected timeframes. Specifically:It averages the avg_pos values (pos1, pos2, pos3, pos4) calculated for each timeframe.
Each avg_pos is itself an average of the normalized positions of the high, low, and close prices relative to the Bollinger Bands for that timeframe.
This multi-timeframe averaging smooths out short-term fluctuations and provides a broader perspective on the price's position within the volatility bands.
Interpretation:
0.0 The price is at or below the lower Bollinger Band across all timeframes (indicating potential oversold conditions).
0.15: A customizable level (green band) which can be used for exiting short positions or entering long positions.
0.5: The midline, where the price is at the average of the Bollinger Bands (neutral zone).
0.85: A customizable level (orange band) which can be used for exiting long positions or entering short positions.
1.0: The price is at or above the upper Bollinger Band across all timeframes (indicating potential overbought conditions).
The colored regions and moving averages (if enabled) help identify trends or crossovers for trading signals.
Example:
If the 30min timeframe shows the close at the upper band (position = 1.0), the 60min at the midline (position = 0.5), the 240min at the lower band (position = 0.0), and the daily at the upper band (position = 1.0), the avg_position would be:(1.0 + 0.5 + 0.0 + 1.0) / 4 = 0.625
This value (0.625) would plot in the orange region (between 0.85 and 0.5), suggesting the price is relatively strong but not at an extreme.
Notes:
The use of lookahead=barmerge.lookahead_on ensures the indicator uses the latest available data, making it more real-time, though its effectiveness depends on the chart timeframe and TradingView's data feed.
The indicator’s sensitivity can be adjusted by changing bb_length ("Bollinger Band MA Length" in the Input tab), bb_mult ("Bollinger Band Standard Deviation," also in the Input tab), or the selected timeframes.

Master Simple Indicator 2.0Master Simple Indicator 2.0 combines dynamic moving average signals with ATR-based price bands. It plots a volatility range around the current price using customizable ATR length, smoothing, and multiplier settings, while also highlighting long/short opportunities when price crosses a 120-period moving average. Visual cues and alerts help identify momentum shifts, trend direction, and potential trade entries across all timeframes.

Session Pivots + EMA20/50 + Bollinger BandsMulti-tool indicator combining session pivots, EMA trend filters, Bollinger Bands, and alerts for intraday trading.
📌 Description
One of the biggest advantages of this indicator is that it supports TradingView’s ALERT system, so traders can be notified the moment price crosses the daily/session pivot level. This allows faster decision-making without constant chart watching.
This script combines three powerful tools into a single indicator:
Session Pivot Levels (with Support/Resistance): Automatically calculates pivot, R1–R3 and S1–S3 levels based on the previous trading session (London, New York, Asia, or custom). Levels are plotted with clean labels and connector lines so you always see the exact price values ahead of time.
EMA Trend Filters (20 & 50): Tracks short- and medium-term market direction with two popular exponential moving averages, helping confirm entries and exits.
Bollinger Bands (fully customizable): Adds volatility bands with choice of SMA, EMA, SMMA, WMA, or VWMA for the middle line, plus adjustable standard deviation and offset.
✅ Key Features
Auto-detects London, New York, and Asian sessions or set your own custom session.
Displays up to 3 levels of support and resistance from the previous session.
Clean label display with customizable theme options (Dark, Light, Custom).
Alerts included: Get notified instantly when price crosses above or below the Pivot.
EMA20/50 trend confirmation built-in.
Bollinger Bands with multiple moving average types and volatility settings.
Works for Forex, Crypto, Indices, Commodities — optimized for intraday & scalping.
This makes it a complete intraday toolkit, reducing the need to load multiple separate indicators.
📄 Full documentation available here: [ link ]

Volatility Zones (VStop + Bands) — Fixed (v2)📝 What this indicator is
This script is called “Volatility Zones (VStop + Bands)”.
It is an ATR-based volatility indicator that combines dynamic volatility bands, a Volatility Stop line (VStop), and volatility spike detection into a single tool.
Unlike moving average–based indicators, this tool does not rely on averages of price direction. Instead, it measures the market’s true volatility and reacts to expansions or contractions in price ranges.
________________________________________
⚙️ How it is built
The indicator uses several volatility-based components:
1. Average True Range (ATR)
o ATR is calculated over a user-defined length.
o It measures how much price typically moves in a given number of bars, making it the foundation of this indicator.
2. Volatility Bands
o Upper band = close + ATR × factor
o Lower band = close - ATR × factor
o The area between them is shaded.
o This gives traders an immediate visual sense of market volatility width — wide bands = high volatility, narrow bands = quiet market.
3. Volatility Stop (VStop)
o A stateful trailing stop based on ATR.
o It tracks the highest (or lowest) price in the current trend and places a stop offset by ATR × multiplier.
o When price crosses this stop, the indicator flips trend direction.
o This creates a dynamic stop-and-reverse mechanism that adapts to volatility.
4. Trend Zones
o When the trend is bullish, the stop is green and the chart background is shaded softly green.
o When bearish, the stop is red and the background is shaded softly red.
o This makes the market’s directional bias visually clear at all times.
5. Flip Signals (Buy/Sell Arrows)
o Whenever the VStop flips, arrows appear:
Green BUY arrows below price when the trend turns bullish.
Red SELL arrows above price when the trend turns bearish.
o These are also tied to built-in alerts for automation.
6. Volatility Spike Detection
o The script compares current ATR to its recent average.
o If ATR suddenly expands above a threshold, a small yellow “VOL” marker appears at the top of the chart.
o This highlights potential breakout phases or unusual volatility events.
7. Stop Labels
o At every trend flip, a small label appears at the bar, showing the exact stop level.
o This makes it easy to use the stop as a reference for risk management.
________________________________________
📊 How it works in practice
• When price is above the VStop line, the market is considered in an uptrend.
• When price is below the VStop line, the market is in a downtrend.
• The bands expand/contract with volatility, helping traders gauge risk and position sizing.
• Flip arrows signal when trend direction changes.
• Volatility spikes warn traders that the market is entering a higher-risk phase, often before strong moves.
________________________________________
🎯 How it may help traders
• Trend following → Helps traders identify whether the market is trending up or down.
• Stop placement → Provides a dynamic stop level that adjusts to volatility.
• Volatility awareness → Shaded bands and spike markers show when the market is likely to become unstable.
• Trade timing → Flip arrows and labels help identify potential entry or exit points.
• Risk management → Wide bands indicate higher risk; narrow bands suggest safer, tighter ranges.
________________________________________
🌍 In what markets it is useful
Because the indicator is based purely on volatility, it works across all asset classes and timeframes:
• Stocks & ETFs → Helps identify breakouts and long-term trends.
• Forex → Very useful in spot FX where volatility shifts frequently.
• Crypto → ATR reacts strongly to high volatility, helping traders adapt stops dynamically.
• Futures & Commodities → Great for tracking trending commodities and managing risk.
Scalpers, swing traders, and position traders can all benefit by adjusting the ATR length and multipliers to suit their trading style.
________________________________________
💡 Originality of this script
This is not just a mashup of existing indicators. It integrates:
• ATR-based Volatility Bands for context,
• A stateful Volatility Stop (adapted and rewritten cleanly),
• Flip arrows and labels for actionable trading signals,
• Volatility spike detection to highlight regime shifts.
The result is a comprehensive volatility-aware trading tool that goes beyond just plotting ATR or trend stops.
________________________________________
🔔 Alerts
• Buy Flip → triggers when the trend changes bullish.
• Sell Flip → triggers when the trend changes bearish.
Traders can connect these alerts to automated strategies, bots, or notification systems.

TrendBreaks & MA Divergence v1.3 — couleurs perso (panel)clean and easy predictive mouvements and swing stratagy
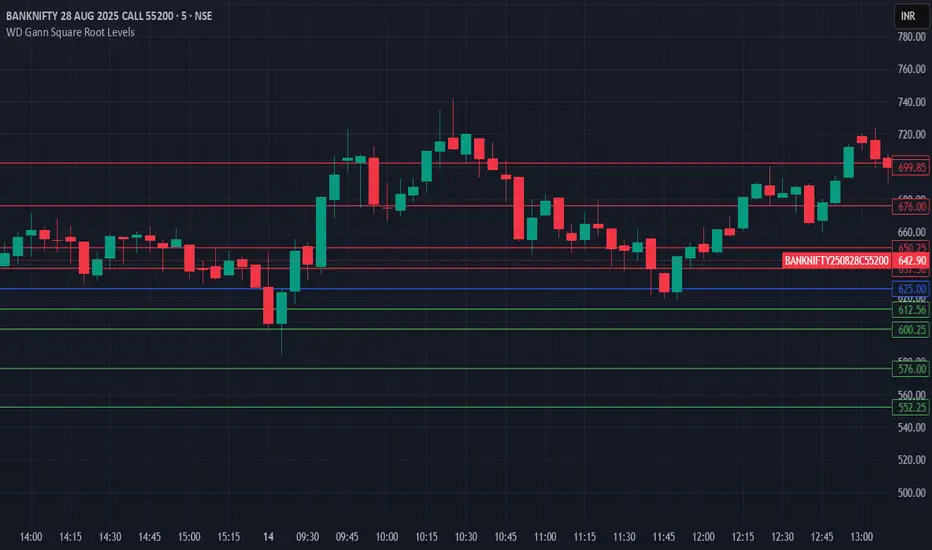
HTH - WD Gann Square Root LevelsHTH - WD Gann Square Root Levels will plot lines for support and resistance
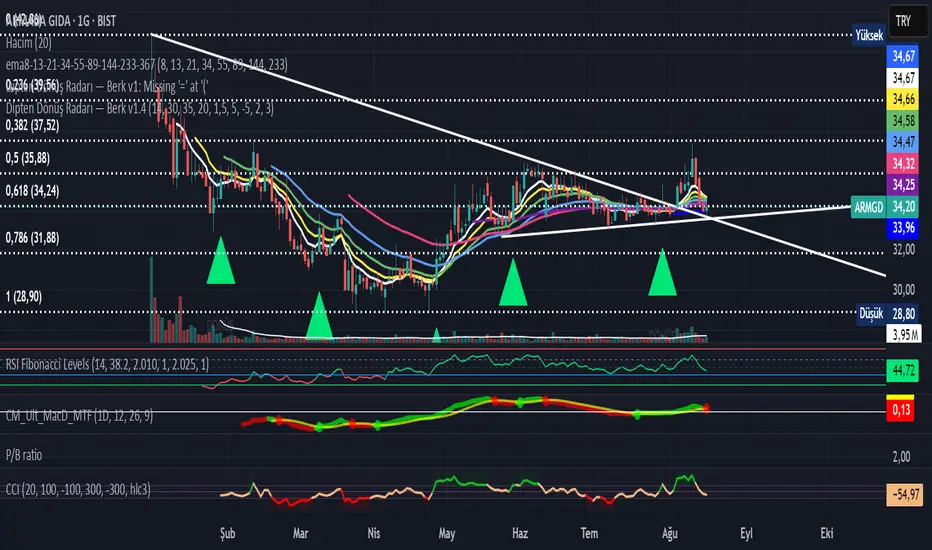
Reversal Radars — Berk v2.0 (Bottom & Top)1) Combined script (Dip+Tepe)
Title:
Reversal Radars — Berk v2.0 (Bottom & Top)
Description (EN):
What it does
Two high-probability reversal detectors in one indicator: a Bottom Reversal Radar (long bias) and a Top Reversal Radar (short/hedge bias). Each radar aggregates multiple conditions into a single score and triggers when Score ≥ Threshold.
How it works
RSI regime shift: Bottom = recovery after oversold (touched 30, crosses up 35). Top = roll-over from overbought (touched 70, crosses down 65).
MACD cross: Bull (up) for bottoms, Bear (down) for tops.
EMA8 filter: Close above (bottom) / below (top) EMA(8).
Structure break (BOS): Close above recent swing high / below recent swing low (lookbackBars, using precomputed highest/lowest to avoid inconsistencies).
EMA200 proximity: Price within a configurable band (default −5% … +2%).
Volume expansion: Volume ≥ SMA(20) × multiplier (default 1.5×).
Divergence: Pivot-confirmed (3/3) bullish (bottom) or bearish (top) RSI divergence.
Scoring: RSI shift +2, divergence +2, MACD +1, EMA8 +1, BOS +1, Volume +1, EMA200 band +1.
Signals & Alerts
Bottom: label “DÖNÜŞ↑” and alert “Dipten Dönüş — Ana Sinyal” when scoreLong ≥ thrLong.
Top: label “DÖNÜŞ↓” and alert “Tepeden Dönüş — Ana Sinyal” when scoreShort ≥ thrShort.
Use Once per bar close for stable alerts.
Inputs
lenRSI, rsiOS=30, rsiRecover=35, rsiOB=70, rsiFall=65, volLen=20, volMult=1.5, lookbackBars=5, ema200 band (−5…+2%), thrLong/thrShort, toggles for Bottom/Top.
Timeframes & tips
Best on Daily/4H. Tighten thresholds (e.g., 4) and raise volume multiplier (1.8–2.0×) on lower TFs or thin liquidity.
No-repaint note
Evaluated on bar close; pivot divergences confirm with a natural ~3-bar delay.
Disclaimer
Educational use only. Not financial advice.
Tags: reversal, divergence, rsi, macd, ema, volume, trend, screener, stocks, crypto, bist
2) Bottom-only (Dip)
Title:
Bottom Reversal Radar — Berk v1.4
Description (EN):
Purpose
Scores bottoming conditions and triggers when Score ≥ Threshold (default 3).
Components
RSI recovery after oversold (30→35), MACD bull cross, close above EMA8, BOS above recent swing high, near-EMA200 band (−5…+2%), volume ≥ SMA(20)×1.5, and pivot-confirmed (3/3) bullish RSI divergence. Weights: RSI +2, Divergence +2, others +1.
Usage
Add to chart, set alert “Dipten Dönüş — Ana Sinyal”, Once per bar close. Works on any timeframe (need ≥200 bars for EMA200). Daily/4H recommended.
No-repaint
Bar-close evaluation; divergence confirms with ~3 bars.
Tags: bottom, reversal, rsi, macd, ema, volume, divergence
3) Top-only (Tepe)
Title:
Top Reversal Radar — Berk v1.0
Description (EN):
Purpose
Detects topping risk and triggers when Score ≥ Threshold (default 3) for exits/hedges.
Components
RSI roll-over from overbought (70→65), MACD bear cross, close below EMA8, BOS below recent swing low, near-EMA200 band, volume ≥ SMA(20)×1.5, and pivot-confirmed (3/3) bearish RSI divergence. Weights: RSI +2, Divergence +2, others +1.
Usage
Add to chart, set alert “Tepeden Dönüş — Ana Sinyal”, Once per bar close. Daily/4H preferred; tighten thresholds on lower TFs.
No-repaint
Bar-close evaluation; divergence confirms with ~3 bars.
Tags: top, reversal, rsi, macd, ema, volume, divergence

Bottom Reversal Radar — Berk v1.4Bottom Reversal Radar — Berk v1.4
What it does:
Combines RSI recovery after oversold, MACD bull cross, close above EMA8, near-EMA200 proximity, volume expansion, and simple bullish divergence (pivot lows) into a single score.
Signal: Trigger when Score ≥ Threshold (default 3). Set alert via Create Alert → “Dipten Dönüş — Ana Sinyal” → Once per bar close.
How it works
RSI recovery: After touching oversold (30), RSI crosses up 35 within last X bars.
MACD bull cross: MACD Line crosses above Signal.
Close above EMA8 and BOS (close above recent swing high) confirm momentum.
Near EMA200: Price within −5%…+2% band adds a point.
Volume spike: Volume ≥ 1.5× SMA(20) adds a point.
Bullish divergence: Lower price low + higher RSI low (pivot 3/3) adds a point.
Inputs
RSI(14), rsiOS=30, rsiRecover=35, Volume SMA(20) with 1.5× multiplier, EMA200 proximity band −5%…+2%, lookbackBars=5, Score threshold default 3.
Usage tips
Best on Daily / 4H. If too many false positives: raise threshold to 4 and volume to 1.8–2.0×.
Pair with Screener filters: RSI≥35, MACD Line>Signal, Price above EMA8, Volume/Avg(20)≥1.5, and near EMA200 (%).
Disclaimer
For educational purposes only. Not financial advice.
Release notes (v1.4)
Fixed bullDiv typo; simplified visuals; Pine v5.
Tags: rsi, macd, ema, volume, divergence, reversal, trend, screener, bist, stocks, crypto
High Volume Highlight - Pto compare volume indicator from prev bars. How to use it, short it when the red bar shows and long it when the green bar shows
Weekly and Daily EMA levelsThis Pine Script indicator provides important weekly and daily levels for lower time frame traders, whom trades based on reaction of these levels.
Dedicated to Prof Michael G
Key Features:
Multi-timeframe EMAs: Shows 12, 21, 50, 100, and 200 period EMAs from both Weekly and Daily timeframes
Horizontal dotted lines: Uses plot.style_linebr to create the dotted/dashed line effect
Works on all timeframes: The lines will appear on any chart timeframe you're viewing
Customizable: Individual toggles for each EMA period and timeframe
Settings Available:
Toggle Weekly/Daily EMAs on/off
Enable/disable individual EMA periods (12, 21, 50, 100, 200)
Customize colors for each EMA line
Adjust line width
Optional labels showing current EMA values
How to Use:
Copy the code into TradingView's Pine Editor
Click "Add to Chart"
Adjust settings in the indicator's Style tab as needed
The weekly EMAs appear with slightly more opacity (30%) while daily EMAs have higher transparency (60%) to help distinguish between timeframes. The lines will automatically update as new bars form and will be visible regardless of what timeframe you're currently viewing on your chart.

