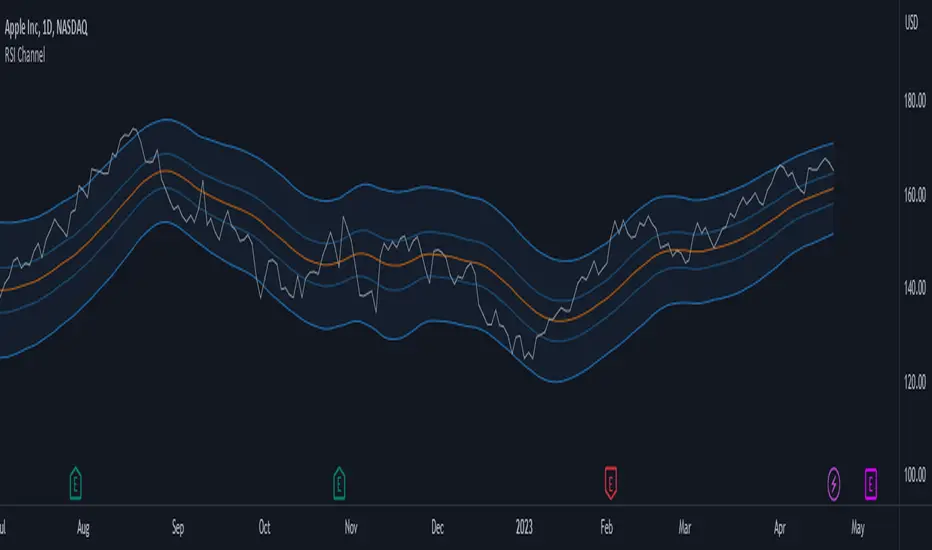
Simple way how to use Linear Regression for trading. What we use: • Linear Regression • HMA as a trend filter Logic: Firstly we make simple linear regression moving. It is the white line which appears on the chart. Then we make second line (named: band2) on the chart by multiplying linreg and value difference. The third step is to ad HMA as a trend filter. The...
Provides a volatility adapted channel with range and trend clues.
Updating an older concept here with some more oversold/overbought zones. Pretty self explanatory, red zone indicate overbought zones and green zone is a oversold. Often, price likes to bounce off of the lower bounds of these zones, but it can sometimes extend all the way through the zone onto the upper boundary. There are many lines to this indicator, i prefer...
This is quite a simple script, just plotting a 34EMA on high's and low's of candles. Appears to work wonders though, so here it is. There is some //'d code which I haven't finished working on, but it looks to be quite similar to Bollinger Bands, just using different math rather than standard deviations from the mean. The bands itself is pretty self...
//A follow up for my JMA script. This script is inspired by (and dedicated to) closure of sales (today, Oct 20 '21) of the famous Jurik Research. ... Jurik Research, the real people who been doing real things by using the real instruments, while many others been reading books "How to become a billionaire in 2 days", watching 5687 hours videos of how to use RSI ,...
Experimental: Uses the Box-Cox Transformer with a deflection on the inversion to create log bands. to be used in log scaled charts.
The Ultimate Moving Average Bands were created by me and @RedKTrader and this converts our Ultimate Moving Average into volatility bands that use the same adaptive logic to create the bands. I have enabled everything to be fully adjustable so please let me know if you find a more useful setting than what I have here by default. I'm sure everyone is familiar with...
This indicator takes the moving averages of the rsi values, gives signals in the lower and upper breaks, prevents the rsi upper threshold from signaling above a certain rsi value, as the rsi upper threshold value increases, the number of signals increases and the number of risky signals also increases. As the rsi upper threshold value decreases, the signals...
This is combo strategies for get a cumulative signal. First strategy This System was created from the Book "How I Tripled My Money In The Futures Market" by Ulf Jensen, Page 183. This is reverse type of strategies. The strategy buys at market, if close price is higher than the previous close during 2 days and the meaning of 9-days Stochastic Slow...
The Moving Average Band Width was created by Vitali Apirine (Stocks and Commodities Aug 2021 pg 25) and this is of course an extension based on my previous Moving Average Bands script. For those of you that aren't aware, the Band Width indicator is an indicator that tells you how close the upper and lower bands are to each other which is a great determination of...
This indicator allows you to add up to 3 volatility bands to VWAP based on its Standard Deviation. Best use is for intraday but you can choose higher timeframes too. For day trading a band of 3 standard deviations usually works well as an overbought/oversold region, allowing for mean reversion trading, but you are free to come up with your own strategies. Enjoy!
CONCEPT At the heart of True Bands is a moving average with improved timing and smoothness. Due to its adaptability to the trend by moving average, identifying overbought or oversold phases becomes extremely easy. FEATURES The ability to use this indicator on various coins, assets, bonds, etc. is an extremely important advantage, but besides this, this...
Introduction : Channels are very useful tools to assess overextended price, volatility and upcoming retracement or impulsive moves (such as Bollinger Band squeezes). It is an indispensable addition to any trader using Mean Reversion theory for a scalp-trade or swing-trade. This script contains : - 2 channels Keltner-style, usingthe True Range for...
This is a public and open-source lighter version compared to the "Overextended Price Channel" which is provided complimentaty to the Trend Insight System. Introduction : Channels are very useful tools to assess overextended price, volatility and upcoming retracement or impulsive moves (such as Bollinger Band squeezes). It is an indispensable addition to any...
Trend indicator. It is based on a simple moving average, the maximum and minimum of this moving average for the period. When the moving average coincides with its maximum for the period , the trend is rising, when the moving average coincides with its minimum for the period, the trend is falling. The optimal periods should be selected for each timeframe and...
The Moving Average Bands were created by Vitali Apirine (Stocks and Commodities July 2021 pg 16) and this is a very handy trend following indicator that will give you the overall trend of the underlying stock. As the bands rise then the stock is in an uptrend and as they fall then it is a downtrend. If the bands stay flat then it is a sideways and/or choppy...
Supertrend Bands What is the Supertrend indicator? "The Supertrend indicator is a trend following overlay on your trading chart, much like a moving average, that shows you the current trend direction. The indicator works well in a trending market but can give false signals when a market is trading in a range. It uses the ATR (average true range) as part of...
Alright, as per usual with these, I end up adapting an existing indicator to what I want to accomplish. So this is based off the built in VWAP indicator. I added in the gummy worm to easily identify the trend, as well as the related bands to identify potential areas to either reverse position or to trim an existing one. The middle part of the bands are the gummy...