PRISM Oscillators Set {PREMIUM}The PRISM Oscillator Set consists of:
(1) A modified-pSAR derived main driving oscillator (P-Oscillator).
(2) With MAJeStic (Momentum, Acceleration, Jerk, Snap) Oscillators Set (M-, A-, J-, S-Oscillators respectively).
User can switch the main oscillator to RSI-mode (default), as well as reverting to configurable EMA/SMA MACD mode as well.
The P-Oscillator
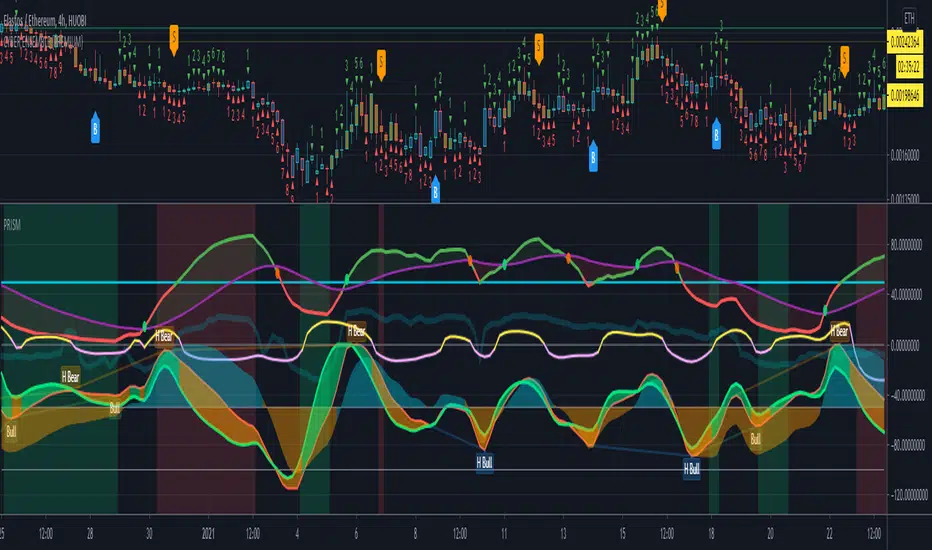
The P-Oscillator (centered at 50 in the y-axis) indicates the instantaneous bullish/bearish cycle of the market, and the degree of which.
A MA-line is provided as well (VWMA-mode is set as the default, but user can choose to switch to SMA-mode).
The crossing of the P-Oscillator into its MA-line signals a significant turn in the P-Oscillator , similar to how the cross between MAs are being used to signal a golden/death-cross (example: P-Oscillator crossing down its MA-line indicates a probable shift into the bearish phase).
The MAJeStic-Oscillators
The MAJeStic-Oscillators are derived from the main P-Oscillator .
The M-Oscillator is the momentum oscillator, to more clearly visually indicate the current momentum phase of the main P-Oscillator -- i.e. when the oscillator is above the zeroline at -50, the P-oscillator is in an uptrend; and the magnitude of which indicates the velocity (or to be more precise, the speed) of the current momentum trend.
The AJ-Ribbon consists of the acceleration and jerk oscillators, to indicate the hidden underlying trends in the momentum. They can be thought of as the hidden force/hand that pushes and pulls the momentum oscillator upwards or downwards.
Both the M-Oscillator and the AJ-Ribbon are y-shifted down with its zeroline set at -50, simply for the purpose of clarity of presentation for this multiple-oscillator script.
The S-Oscillator is centered about the 0 as its zeroline. It is a highest-order indicator, derived from the AJ-Ribbon , and is an extremely sensitive indicator -- which is able to dig up even the more subtle market trends that may later cascade into a more macro trend. For example: when it crosses from the negative into the positive (especially with a steeply positive slope) and holds above the zeroline, it is then likely that price will see some upside movement ahead (depending on the magnitude of the oscillator as well), even if it may presently be simply moving sideways or even downwards (i.e. a divergence in the S-oscillator wrt the current price movement).
The alignment of the various indicators gives the clearest signal of the market trend, however, that naturally isn't always the case. Hence, when signals from the oscillators looks conflicted, the higher order oscillators (i.e. the AJ-Ribbon, and the S-Oscillator) will be helpful indicators of possible movement incoming; alternatively looking for divergence and hidden divergence of the P-Oscillator (set to RSI-mode) is also an effective strategy.
This oscillator set is suitable to be applied on any timeframes and on any charts.
This oscillator does not give precise price targets, but only offers a qualitative view of the present as well as the probable incoming price action.
To (attempt to) predict price targets, I personally use the PRISM Oscillator Set in conjunction a combination of various support & resistance analytical strategies: e.g. VPVR-levels, moving averages, trend-lines, Ichimoku Cloud, etc. and looking/waiting for sufficient candle closing and break-outs for confirmation, etc.
The PRISM Oscillator Set provide a momentum-focused perspective of the current market.
While my other script, Cyber Ensemble ( which generates buy/sell signals base on the scoring of a large ensemble of technical indicators + and modified by a series of filters ), provides a technical perspective of the current market; and which I frequently use conjunction with the PRISM Oscillator Set .
~ * ~ * ~ * ~ * ~ * ~ * ~ * ~ * ~ * ~ * ~ * ~ * ~ * ~ * ~ * ~ * ~ * ~ * ~ * ~ * ~
Note:
In no way is this intended as a financial/investment/trading advice. You are responsible for your own investment/trade decisions.
Please exercise your own judgement for your own trades base on your own risk-aversion level and goals as an investor or a trader. The use of OTHER indicators and analysis in conjunction (tailored to your own style of investing/trading) will help improve confidence of your analysis, for you to determine your own trade decisions.
~ * ~ * ~ * ~ * ~ * ~ * ~ * ~ * ~ * ~ * ~ * ~ * ~ * ~ * ~ * ~ * ~ * ~ * ~ * ~ * ~
Please PM me for access information.
© cybernetwork
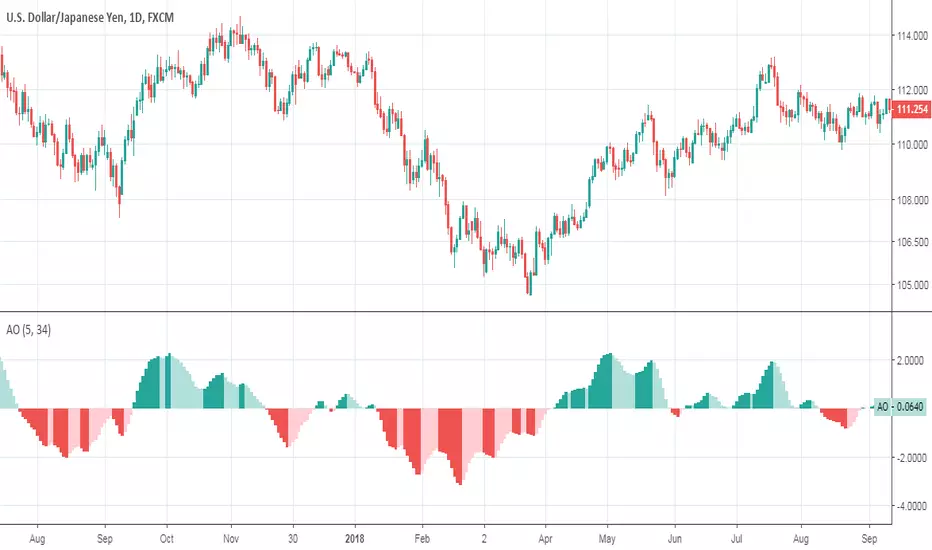
오썸 오실레이터 (AO)
Awesome Accelerator Oscillator (combo AO/AC)===========
Awesome Accelerator Oscillator
===========
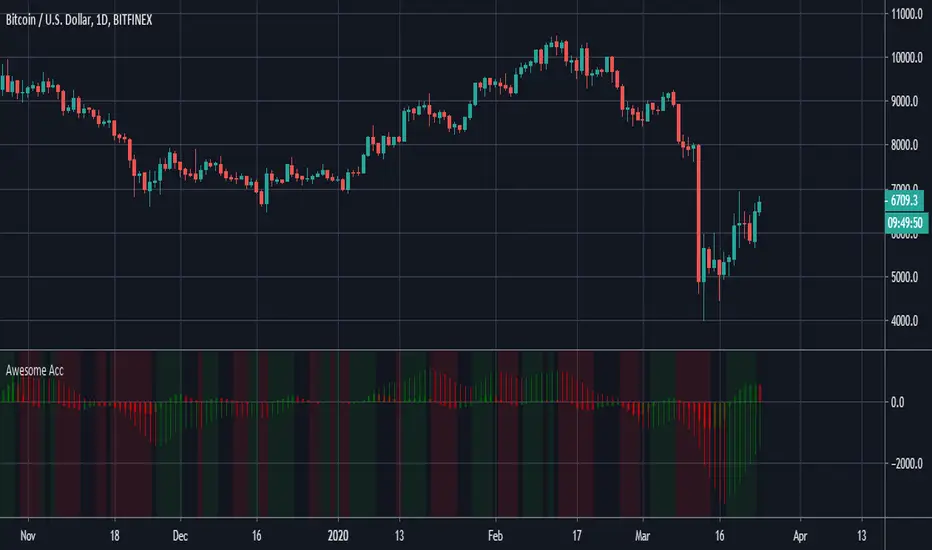
A Combination of the Awesome Oscillator and the Accelerator Oscillator in one handy histogram.
-----------
Editable settings include Fast Length , Slow Length and Trigger Length to provide a comprehensive indicator from a combination of Bill Williams' two most famous oscillators.
Background color changes depending on overall/combined oscillator direction (gray for null ).
There's not much else to say about this indicator - does what it says on the tin!
Good Luck and Happy Trading!
Indicator: Price Weight Oscillator [xQT5]This is my revision of AO (Awesome Oscillator) that can give more correct and early signals as on my opinion.
I'm used a original formula of AO and modified it with high and low prices adding.
Enjoy it!

AO + AC with Buy/Sell SignalsThis is the Awesome / Accelerator Oscillator originally developed by Bill WIlliams, and includes shapes and alerts which correspond as Buy and Sell signals.

Awesome Oscillator with EMAThe indicator is the Awesome Oscillator but with Exponential Moving Averages . I simply replaced SMA by EMA in the calculus and added, as an option, smoothing with a variable period. It reduces greatly lags and is more efficient when the price moves big.
It is used the same way the standard Awesome Oscillator works. You can refer to the TradingView page about this simple indicator.
I added smoothing as an option too. You can add it or remove it and set the period you want in the settings of the indicator.

Awesome Oscillator Hull MAIt is the Awesome Oscillator , but with a Hull Moving Average. It gives the indicator way more precision about the trend.
It is used the same way the standard Awesome Oscillator works. You can refer to the TradingView page about this simple indicator.
I added smoothing as an option too. You can add it or remove it and set the period you want in the settings of the indicator.

AO By Minh DucAwesome Oscillator By Minh Duc
- Awesome Oscillator
- Fast Line Cross
- Master Trendline
Use for all time frame.
Price: 50$ for a month with user guide trading system.
Contact me: Telegram @minhduc1712

Advanced Awesome OscillatorAwesome oscilator with more options.
You can choose the source, moving averages' period lengths.
MACD histogram style with color change:
Dark green when value goes up above zero.
Light green when value goes down above zero.
Red when value goes down below zero.
Orange when value goes up below zero.

Awesome Oscillator and MACD Histogram by SierraPilot (Lemrin)This is an indicator I stole from Lemrin. I added the plots for the MACD line and the Signal line and also changed the AO and MACD histo to an area plot. MACD = red and green. AO = blue and yellow. Green over top of Blue = possible reversal. Green overlaid over blue = uptrend. Yellow over top of Red = downside reversal possible. Yellow overlaid over Red = downtrend in progress. MACD and Signal line behave normally. Thanks to Lemrin for the majority of the code.

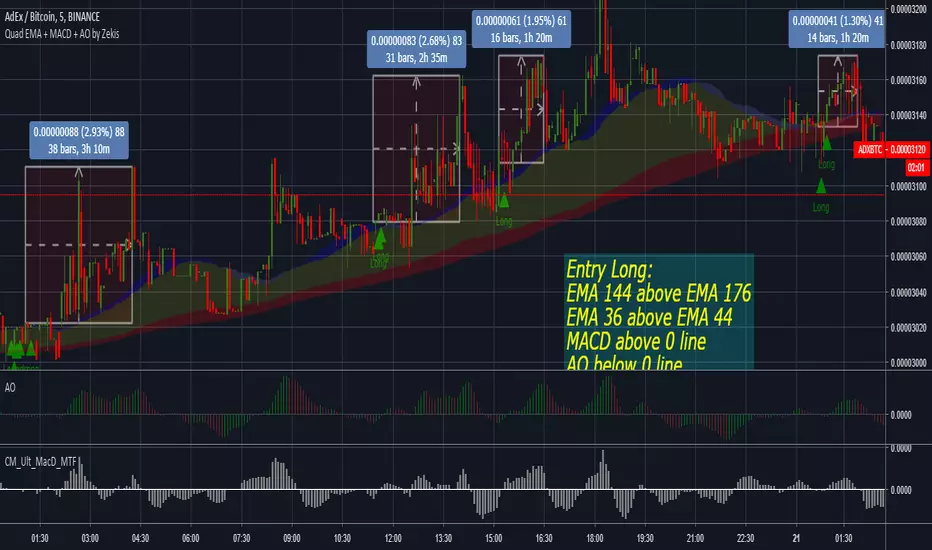
Quadruple EMA + MACD + Awesome Oscillator by ZekisThis strategy is based on quadruple EMAs, MACD and Awesome Oscillator, developed by Nenad Kerkez and simplified by me.
Scalping strategy (lower time frames)
Entry Position
Before we take a buy trade the two above criteria must be met. The 144 EMA must be above the 176 EMA and the 36 EMA must be above the 44 EMA. We then wait for AO to fall below the 0. The final „trigger‟ to the entry is when the MACD closes above the 0 line.
Sell trade is vice versa. 36 EMA must be below 44 EMA and 144 EMA must be below 176 EMA.
TAKE PROFIT and STOP LOSS
10-40 pips. Pivot Point targets.
STOP LOSS above/below last highest high
Enjoy!
@Zekis
Traderset Uni Renko - Awesome OscillatorThis is simply Bill Williams AO oscillator, fabricated with predefined numbers to better fit the Uni Renko charts and my methodology. The reason for publishing this version is that the original numbers (you can see them on the top instance of the oscillator) does not behave that much satisfactory when it comes to renko charting in my methodology !
The AO is not a part of my methodology nor Alligator, but i know some people who would like to have these two tools in renko charts. Here you have it.

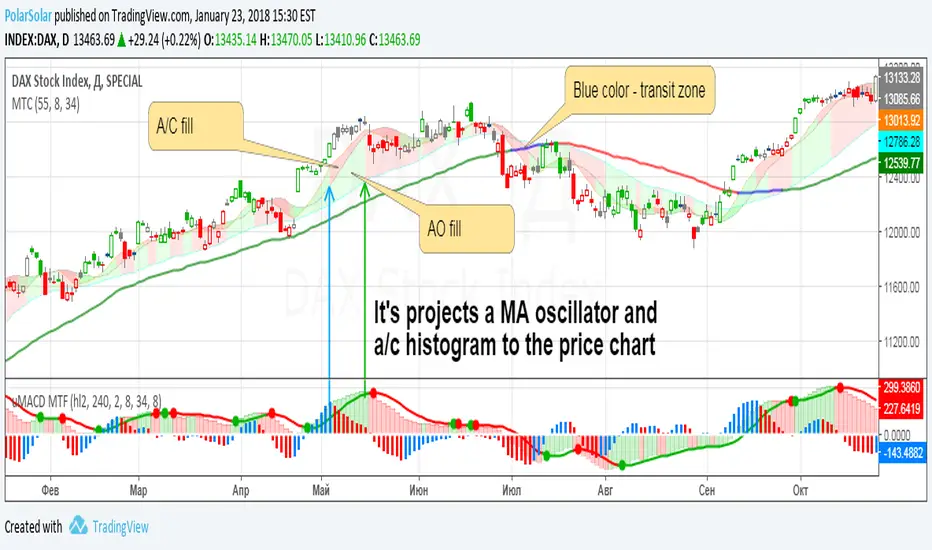
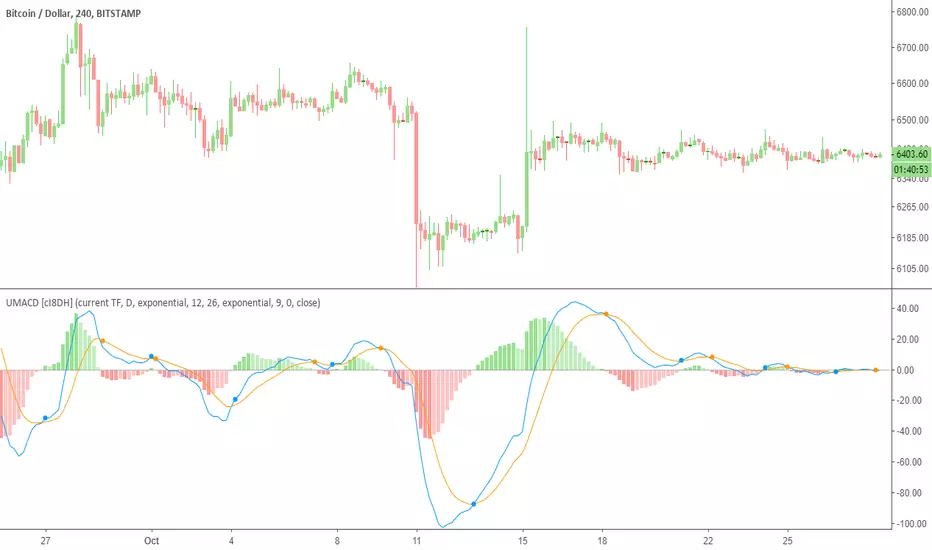
Ultimate MACD (UMACD) [cI8DH]Ultimate MACD ( UMACD ) includes True MACD fix, normalized MACD, multi time frame, bar coloring, and false cross avoidance options. It can also replicate Bill Williams Awesome Oscillator and Accelerator Oscillator. By default, this indicator is configured to work like the built-in MACD indicator. You need to customize it to your liking. Chart below shows example multi time frame setup.
True MACD and normalization
True MACD fix is similar to True RSI fix. The chart below proves that MACD is asymmetrical. This issue is most visible when analyzing charts across wide price ranges. It shows a logical problem in MACD, and most other indicators, as they can give you conflicting signals. For example, it can show long signal for both TRYUSD and its inverse pair USDTRY simultaneously. True MACD fixes this issue as shown in the chart below. Interestingly, this fix also normalizes MACD which is a major improvement upon regular MACD . (FYI, True MACD fix uses a different mechanism than my previous NMACD indicator.)
Avoiding false signals
This feature is very useful to avoid trading during sideways. To use this feature, set the std deviation multiplier option to a number greater than 1. I did some backtests on BTC chart with contract size set to 100% equity. It showed significant improvements for the time frames that I tested. (std deviation multiplier set to 1.5 @1h TF: 4x improvements, @2h: near 2x, 0.7 @4h: 2x, 0.4@12h: 3x, 0.4@daily: 1.5x). I also backtested True MACD fix separately and it showed significant improvement for most time frames.
Bar coloring
Bar coloring works similar to my previous indicators, Ultimate Money Flow and Ultimate RSI , and is subject to change in the future.
Bill Williams Awesome Oscillator and Accelerator Oscillator
Chart below both validates calculations in this indicator and also shows you how you can replicate Bill Williams AO indicators. You can apply all the features added to MACD to these indicators.
Here is a TL;DR list of my indicators to save you some time from looking at my obsolete indicators.
PS: I might publish the asymmetry fix as True MACD or as a general fix to all price-based indicators as an open source script in the future.
Awesome Oscillator (AO) - LogImproved Awesome Oscillator.
* Supports both Logarithm/Linear scale
* Shows divergences on higher timeframes (which it didn't before)
* Twin peaks appear much more frequently
* Less lagging, able to spot the major tops earlier on after huge price spikes/declines (shouldn't make a difference on lower timeframes)

Awesome Oscillator (AO) - LogAO with Log support, less lagging with bigger price movements, clearer divergences between waves, and also more frequent Twin peaks.

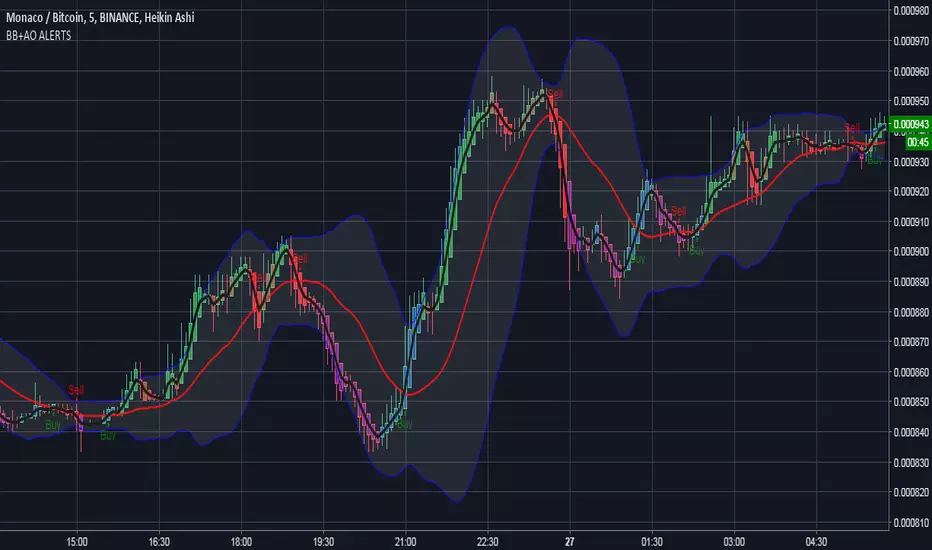
BB+AO ALERTSto be used with AO indicator, based on forex strat --
www.forexstrategiesresources.com
works on 1/3/5/15/30 candles, buy signals are best when the black 3 fast ema crosses up through the red mid band

ATRIX Momentum OscillatorAMO is a part of Atrix trade system. TTC v2 replacement.
Highly recommend to use with Atrix (Alligator on TRIX).

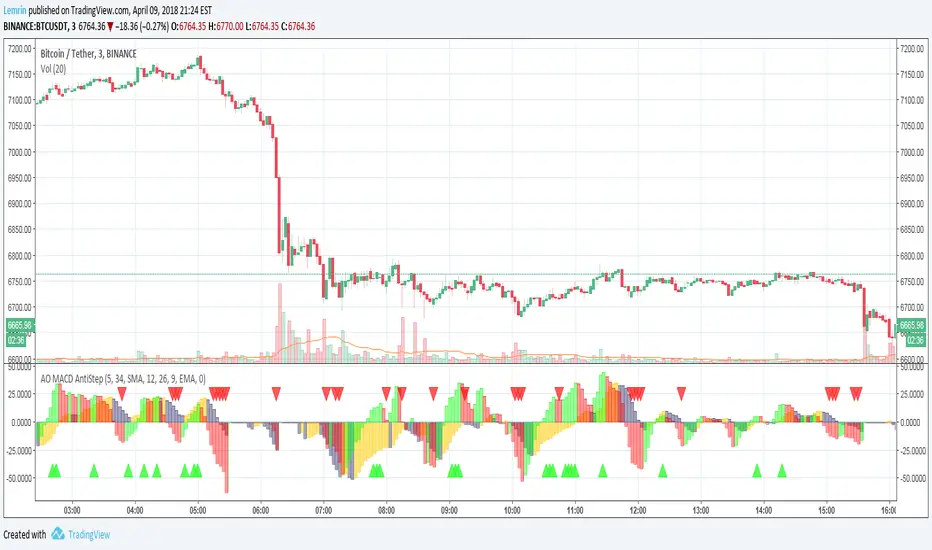
Awesome Oscillator and MACD, AntiStep VersionAny indicator based on moving averages (MAs) lags real-time movement. Immediately after large ("step") changes in level, the pre-step values that are still within the MA window cause the result to falsely reflect continued movement, even if real-time values remain flat or move in the opposite direction.
To counter this, when a step change of a configurable size is detected, my technique temporarily shrinks the MA window size to include only those values occurring since the step change, and then allow the size to increase to normal length as we move away from the step change.
Changes from my previous AO/MACD indicator:
Added anti-step capabilities, including brand-new functions that implement my anti-step technique in ema() and rma().
Created generalized alpha_ma() function, which allows ema function creation using custom alpha structures.
Created "_external" versions of all antistep functions, allowing step detection to be based on some other series, aside from the one being averaged (this is required for the macd signal ma).
Added options to calculate ao and macd using SMA, EMA, or RMA, including anti-step versions of all three.
Added bull and bear signal indicators based on previous descriptions.
Comparison with anti-step enabled and disabled:
Comparison with different tolerance levels (positive tolerance detects fewer steps; negative tolerance detects more steps):
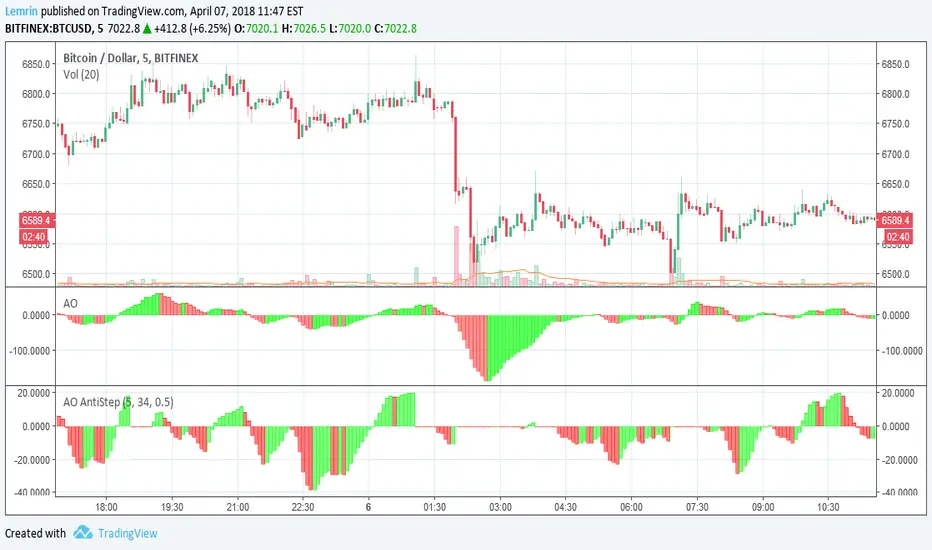
Awesome Oscillator with AntiStep CorrectionHere is the well-known Awesome Oscillator (AO), which I use to present the real purpose of this post: a function that provides step correction for simple moving averages (SMAs).
We all know that any indicator based on moving averages lags real-time movement. Normally this is fine, but just after large ("step") changes in level, the pre-step values that are still within the SMA window cause the result to falsely reflect continued movement, even when real-time values remain flat.
To counter this, when a step change of a configurable size is detected, I temporarily shrink the SMA window size to include only those values occurring since the step change, and then allow the size to increase to normal length as we move away from the step change. This is accomplished within the antistep_sma() function.
Note that this will cause SMAs of different lengths (e.g. those used in the AO) to be temporarily equal, until the shorter of the two reaches its normal size and begins to leave the longer one behind again. You can see this above, where the AO, which is the difference of two SMAs, goes to 0 immediately after a sufficiently large step change--configured to 0.5% in this case.
Awesome Oscillator and MACD HistogramThis is a quick script that combines two standard indicators, the Awesome Oscillator and MACD histogram, to highlight the beginnings of periods of fast price movement (divergence between the two). Since MACD's EMA responds more quickly than AO's SMA, look for periods of green over gold as a bullish signal, and red under blue as a bearish signal.
Of course both indicators are lagging in nature, but the presence of this divergence often leads larger, continued movement in the same direction.
Bullish Signals
Change from red to green below 0 with either blue or gold above 0 (strengthened on second green bar):
Rising green above 0 with gold below 0:
Bearish Signals
Change from green to red above 0 with either blue or gold below 0 (strengthened on second red bar):
Deepening red below 0 with blue above 0: