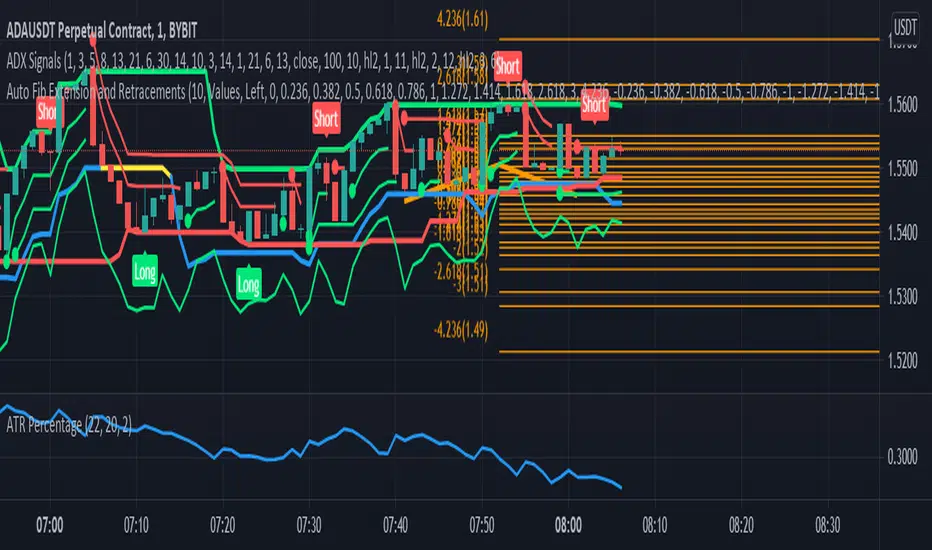
Auto Fibonacci Retracements with Alerts [SwissAlgo]AUTO-FIBONACCI RETRACEMENT: LEVELS, ALERTS & PD ZONES
Automatically maps Fibonacci retracement levels with Premium/Discount (PD) zones and configurable alerts for technical analysis study.
------------------------------------------------------------------
FEATURES
Automatic Fibonacci Levels Detection
Identifies swing extremes (reference high and low to map retracements) from a user-defined trend start date and trend indication automatically
Calculates 20 Fibonacci levels (from -2.618 to +2.618) automatically
Dynamically updates Fib levels as price action develops, anchoring the bottom (in case of uptrends) or the top (in case of downtrends)
Detects potential Trend's Change of Character automatically
Premium/Discount (PD) zone visualization based on trend and price extremes
Visual Components
Dotted horizontal lines for each Fibonacci level
'Premium' and 'discount' zone highlighting
Change of Character (CHoCH) marker when a trend anchor breaks (a bottom is broken after an uptrend, a top is broken after a downtrend)
Adaptive label colors for light/dark chart themes
Alert System
Configurable alerts for all Fibonacci levels
Requires 2 consecutive bar closes for confirmation (reduces false signals)
CHoCH alert when a locked extreme is broken
Set up using "Any alert() function call" option
------------------------------------------------------------------
USE CASES
Two Primary Use Cases:
1. PROSPECTIVE TREND MAPPING (Real-Time Tracking)
Set start date at or just before an anticipated swing extreme to track levels as the trend develops:
For Uptrend : Place start date near a bottom. The bottom level locks after consolidation, while the top updates in real-time as the price climbs higher
For Downtrend : Place start date near a top. The top-level locks after consolidation, while the bottom updates in real-time as the price falls lower
This mode tracks developing price action against Fibonacci levels as the swing unfolds.
2. RETROSPECTIVE ANALYSIS (Historical Swing Study)
Set the start date at a completed swing extreme to analyze how the price interacted (and is interacting) with the Fibonacci levels:
Both high and low are already established in the historical data
Levels remain static for analysis purposes
Useful for analyzing price behavior relative to Fibonacci levels, studying retracement dynamics, and assessing a trading posture
------------------------------------------------------------------
HOW TO USE
Set 'Start Date' : Select Start Date (anchor point) at or just before the swing extreme (bottom for uptrend, top for downtrend)
Choose Trend Direction (Up or Down): direction is known for retrospective analysis, uncertain for prospective analysis
Update the start date when significant structure breaks occur to begin analyzing a new swing cycle.
Configure alerts as needed for your analysis
------------------------------------------------------------------
TECHNICAL DETAILS
♦ Auto-Mapped Fibonacci Retracement Levels:
2.618, 2.000, 1.618, 1.414, 1.272, 1.000, 0.882, 0.786, 0.618, 0.500, 0.382, 0.236, 0.118, 0.000, -0.272, -0.618, -1.000, -1.618, -2.000, -2.618
♦ Premium/Discount (PD) Zones:
Uptrend: Green (discount zone) = levels 0 to 0.5 | Red (premium zone) = levels 0.5 to 1.0
Downtrend: Red (premium zone) = levels 0 to 0.5 | Green (discount zone) = levels 0.5 to 1.0
The yellow line represents the 0.5 equilibrium level
♦ Lock Mechanism:
The indicator monitors for new extremes to detect a Change of Character in the trend (providing visual feedback and alerts). It locks the anchor swing extreme after a timeframe-appropriate consolidation period has elapsed (varies from 200 bars on second charts to 1 bar on monthly charts) to detect such potentially critical events.
------------------------------------------------------------------
IMPORTANT NOTES
This is an educational tool for technical analysis study. It displays historical and current price relationships to Fibonacci levels but does not predict future price movements or provide trading recommendations.
DISCLAIMER: This indicator is for educational and informational purposes only. It does not constitute financial advice or trading signals. Past price patterns do not guarantee future results. Trading involves substantial risk of loss. Always conduct your own analysis and consult with qualified financial professionals before making trading decisions. By using this indicator, you acknowledge and agree to these limitations.
Autofibonacci
AutoFib + Twin Range Filter (Combined)This indicator combines a dynamic Fibonacci retracement tool with a Twin Range Filter trend detection system to help traders identify high-probability trade setups.
Features:
Automatically calculates Fibonacci levels based on a configurable lookback period.
Displays fixed-color Fibonacci zones on the chart for clear visual reference.
Implements the Twin Range Filter to identify trend direction with smoothing and range filtering.
Generates long signals only when price hits the Fibonacci 0.0 level (support) and the filter indicates an uptrend.
Generates short signals only when price hits the Fibonacci 1.0 level (resistance) and the filter indicates a downtrend.
Plots clean long and short labels directly on the chart for easy trade timing.
Alert conditions built in for both long and short signals, combining Fibonacci and trend filter confirmation.
Use this indicator to better time entries by aligning Fibonacci retracement zones with trend momentum signals.

Fibonacci Retracement Engine (DFRE) [PhenLabs]📊 Fibonacci Retracement Engine (DFRE)
Version: PineScript™ v6
📌 Description
Dynamic Fibonacci Retracement Engine (DFRE) is a sophisticated technical analysis tool that automatically detects important swing points and draws precise Fibonacci retracement levels on various timeframes. The intelligent indicator eliminates the subjectivity of manual Fibonacci drawing using intelligent swing detection algorithms combined with multi timeframe confluence analysis.
Built for professional traders who demand accuracy and consistency, DFRE provides real time Fibonacci levels that adapt to modifications in market structure without sacrificing accuracy in changing market conditions. The indicator excels at identifying key support and resistance levels where price action is more likely to react, giving traders a potent edge in entry and exit timing.
🚀 Points of Innovation
Intelligent Swing Detection Algorithm : Advanced pivot detection with customizable confirmation bars and minimum swing percentage thresholds
Multi-Timeframe Confluence Engine : Simultaneous analysis across three timeframes to identify high-probability zones
Dynamic Level Management : Automatically updates and manages multiple Fibonacci sets while maintaining chart clarity
Adaptive Visualization System : Smart labeling that shows only the most relevant levels based on user preferences
Real-Time Confluence Detection : Identifies zones where multiple Fibonacci levels from different timeframes converge
Automated Alert System : Comprehensive notifications for level breakouts and confluence zone formations
🔧 Core Components
Swing Point Detection Engine : Uses pivot high/low calculations with strength confirmation to identify significant market turns
Fibonacci Calculator : Automatically computes standard retracement levels (0.236, 0.382, 0.5, 0.618, 0.786, 0.886) plus extensions (1.272, 1.618)
Multi-Timeframe Security Function : Safely retrieves Fibonacci data from higher timeframes without repainting
Confluence Analysis Module : Mathematically identifies zones where multiple levels cluster within specified thresholds
Dynamic Drawing Management : Efficiently handles line and label creation, updates, and deletion to maintain performance
🔥 Key Features
Customizable Swing Detection : Adjust swing length (3-50 bars) and strength confirmation (1-10 bars) to match your trading style
Selective Level Display : Choose which Fibonacci levels to show, from core levels to full extensions
Multi-Timeframe Analysis : Analyze up to 3 different timeframes simultaneously for confluence identification
Intelligent Labeling System : Options to show main levels only or all levels, with latest-set-only functionality
Visual Customization : Adjustable line width, colors, and extension options for optimal chart clarity
Performance Optimization : Limit maximum Fibonacci sets (1-5) to maintain smooth chart performance
Comprehensive Alerting : Get notified on level breakouts and confluence zone formations
🎨 Visualization
Dynamic Fibonacci Lines : Color-coded lines (green for uptrends, red for downtrends) with customizable width and extension
Smart Level Labels : Precise level identification with both ratio and price values displayed
Confluence Zone Highlighting : Visual emphasis on areas where multiple timeframe levels converge
Clean Chart Management : Automatic cleanup of old drawing objects to prevent chart clutter
Responsive Design : All visual elements adapt to different chart sizes and timeframes
📖 Usage Guidelines
Swing Detection Settings
Swing Detection Length - Default: 25 | Range: 3-50 | Controls the lookback period for identifying pivot points. Lower values detect more frequent swings but may include noise, while higher values focus on major market turns.
Swing Strength (Confirmation Bars) - Default: 2 | Range: 1-10 | Number of bars required to confirm a swing point. Higher values reduce false signals but increase lag.
Minimum Swing % Change - Default: 1.0% | Range: 0.1-10.0% | Minimum percentage change required to register a valid swing. Filters out insignificant price movements.
Fibonacci Level Settings
Individual Level Toggles : Enable/disable specific Fibonacci levels (0.236, 0.382, 0.5, 0.618, 0.786, 0.886)
Extensions : Show projection levels (1.272, 1.618) for target identification
Multi-Timeframe Settings
Timeframe Selection : Choose three higher timeframes for confluence analysis
Confluence Threshold : Percentage tolerance for level clustering (0.5-5.0%)
✅ Best Use Cases
Swing Trading : Identify optimal entry and exit points at key retracement levels
Confluence Trading : Focus on high-probability zones where multiple timeframe levels align
Support/Resistance Trading : Use dynamic levels that adapt to changing market structure
Breakout Trading : Monitor level breaks for momentum continuation signals
Target Setting : Utilize extension levels for profit target placement
⚠️ Limitations
Lagging Nature : Requires confirmed swing points, which means levels appear after significant moves
Market Condition Dependency : Works best in trending markets; less effective in extremely choppy conditions
Multiple Signal Complexity : Multiple timeframe analysis may produce conflicting signals requiring experience to interpret
Performance Considerations : Multiple Fibonacci sets and MTF analysis may impact indicator loading time on slower devices
💡 What Makes This Unique
Automated Precision : Eliminates manual drawing errors and subjective level placement
Multi-Timeframe Intelligence : Combines analysis from multiple timeframes for superior confluence detection
Adaptive Management : Automatically updates and manages multiple Fibonacci sets as market structure evolves
Professional-Grade Alerts : Comprehensive notification system for all significant level interactions
🔬 How It Works
Step 1 - Swing Point Identification : Scans price action using pivot high/low calculations with specified lookback periods, applies confirmation logic to eliminate false signals, and calculates swing strength based on surrounding price action for quality assessment.
Step 2 - Fibonacci Level Calculation : Automatically computes retracement and extension levels between confirmed swing points, creates dynamic level sets that update as new swing points are identified, and maintains multiple active Fibonacci sets for comprehensive market analysis.
Step 3 - Multi-Timeframe Confluence : Retrieves Fibonacci data from higher timeframes using secure request functions, analyzes level clustering across different timeframes within specified thresholds, and identifies high-probability zones where multiple levels converge.
💡 Note: This indicator works best when combined with other technical analysis tools and proper risk management. The multi-timeframe confluence feature provides the highest probability setups, but always confirm signals with additional analysis before entering trades.

Auto-Fibonacci Levels [ChartWhizzperer]Auto-Fibonacci Levels
Discover one of the most elegant and flexible Fibonacci indicators for TradingView – fully automatic, tastefully understated, and built entirely in Pine Script V6.
Key Features:
- Automatically detects the most recent swing high and swing low.
- Plots Fibonacci retracement levels and extensions (including 161.8%, 261.8%) perfectly aligned
to the prevailing trend.
- Distinctive, dashed lines with crystal-clear price labels right at the price scale
for maximum clarity.
- Line length and label offset are fully customisable for your charting preference.
- Absolutely no repainting: Only confirmed swings are used for reliable signals.
- Parameter: "Swing Detection Length"
The “Swing Detection Length” parameter determines how many bars must appear to the left and right of a potential high or low for it to be recognised as a significant swing point.
- Higher values make the script less sensitive (only major turning points are detected).
- Lower values make it more responsive to minor fluctuations (more fibs, more signals).
For best results, adjust this setting according to your preferred timeframe and trading style.
Pro Tip:
Fibonacci levels refresh automatically whenever a new swing is confirmed.
Ideal for price action enthusiasts and Fibonacci purists alike.
Licence:
// Licence: CC BY-NC-SA 4.0 – Non-commercial use only, attribution required.
// © ChartWhizzperer
PullBack_Level_HunterThis script creates an "Auto Fibonacci" indicator that automatically plots selected Fibonacci retracement levels on a chart, based on a defined lookback period. Users can choose from various Fibonacci levels (0.236, 0.382, 0.5, 0.618, or 0.786) via a dropdown input, allowing for quick adjustments to analysis.
**Key Features:**
1. **Fibonacci Level Selection:** Users can select from multiple Fibonacci levels (0.236, 0.382, 0.5, 0.618, and 0.786) for analysis.
2. **Lookback Period:** The script allows users to define a lookback period to determine the highest high and the lowest low for plotting Fibonacci levels.
3. **Fibonacci Level Calculation:** The Fibonacci levels are calculated using two functions:
- `fib_level`: Calculates the Fibonacci level based on the highest high and lowest low of the lookback period.
- `fib_level_from_current`: Calculates the Fibonacci level from the current candle’s high.
4. **Plotting:** The script plots the selected Fibonacci level on the chart, using a red line for the general Fibonacci level and a blue line for the level calculated from the current high.
5. **Dynamic Visualization:** The Fibonacci levels are drawn as step lines to clearly visualize price levels based on historical data and current price action.
This tool is ideal for traders who wish to quickly assess key Fibonacci levels for potential support or resistance within a customizable lookback period.

Visible bars count on chart + highest/lowest bars, max/min AOThe indicator displays the number of visible bars on the screen (in the upper right corner), including the prices of the highest and lowest bars, the maximum or minimum value of the Awesome Oscillator (similar to MACD 5-34-5) for identify the 3-wave Elliott peak in the interval of 100 to 140 bars according to the Profitunity strategy of Bill Williams. The values change dynamically when scrolling or changing the scale of the graph.
In the indicator settings, you can hide labels, lines and change any parameters for the AO indicator - method (SMA, Smoothed SMA, EMA and others), length, source (open, high, low, close, hl2 and others).
‼️ The values are updated within 2-3 seconds after changing the number of visible bars on the screen.
***
Индикатор отображает количество видимых баров на экране (в правом верхнем углу), в том числе цены самого высокого и самого низкого баров, максимальное или минимальное значение Awesome Oscillator (аналогично MACD 5-34-5), чтобы определить пик 3-волны Эллиота в интервале от 100 до 140 баров по стратегии Profitunity Билла Вильямса. Значения меняются динамически при скроллинге или изменении масштаба графика.
В настройках индикатора вы можете скрыть метки, линии и изменить любые параметры для индикатора AO – метод (SMA, Smoothed SMA, EMA и другие), длину, источник (open, high, low, close, hl2 и другие).
‼️ Значения обновляются в течении 2-3 секунд после изменения количества видимых баров на экране.

Auto Fibonacci Retracement // Atilla YurtsevenOverview:
This Pine Script™ is a specialized tool for traders, designed to automatically plot Fibonacci retracement levels over a user-defined date range in trading charts. It also indicates the extent of price retracement within these levels.
Key Features:
Date Range Customization: Users can specify the start and end dates to focus the analysis on a particular trading period.
Dynamic Fibonacci Levels: The script includes various Fibonacci ratios (0.0, 0.236, 0.382, 0.5, 0.618, 0.786, 1.0), with the flexibility to enable or disable individual levels.
Visual Customization: Each Fibonacci level can be customized for color and line style (solid, dotted, dashed). Labels for each level are also configurable.
Retracement Measurement: The script not only draws the Fibonacci levels but also measures and displays how much the price has retraced within these levels.
Extension and Additional Options: Users have options to extend the Fibonacci lines and additional features such as using close values, trend drawing, date range display, and more.
Technical Insights:
The script identifies high and low values within the selected time frame, assessing the market's trend direction.
Within the specified date range, this script effortlessly plots the Fibonacci levels automatically, bringing clarity and precision to your market analysis as it unfolds.
The tool's adaptability makes it suitable for various trading styles and chart preferences.
Intended Use:
This script is particularly valuable for technical analysts and traders who use Fibonacci retracements to identify potential support and resistance areas and understand the depth of market corrections or rallies.
Disclaimer:
This Pine Script™ is offered 'as is', without any guarantees or warranties. It is intended for informational purposes and should not be taken as investment advice. Atilla Yurtseven, the creator of this script, assumes no responsibility for any financial losses or gains that may result from its usage. Users should perform their own due diligence and consult with professional advisors before making any investment decisions.
Remember to follow and comment!
Trade smart, stay safe
Atilla Yurtseven

Auto Fibonacci Levels [MisterMoTA]Using Auto Fibonacci Levels indicator users can find automatically Fibonacci Extension points where price can go after a period of consolidation (sideways or can find points for support/resistance on retracement levels that can be displayed for any defined range.
The script is different from others by letting users to define a consolidation range, user can input the time when range ends and the number of candles for looking back from the defined time, default value is 16 candles.
Users have total control over range definitions, fibonacci numbers, colors and option to show or hide the lines.
The user can choose to display Fibomacci Bullish Expansion levels and also Fibonacci Bearish Expansion level.
After a move hit a resistance or support can be choosed a range to find retracement levels, Bullish or Bearish retracement levels can be displayed checking the options from the indicator pannel.
Here are few examples of usage:
1. Bullish expansion (extension)
2. Bearish expansion (extension)
3. Bullish Retracement
4. Bearish Retracement
The indicator can be used on any timeframe for any pairs, stocks, crypto, forex.

PDHL levels with INTRADAY Auto FIBThe present script includes Previous day High/low levels and once the PDH or PDL breaks the present bar's background changes color according to the direction of price breakout.
It's helpful when working on lower timeframe charts with small screen space, so that the user can know that the PDHL has been taken out in one glance at the chart instead of scrolling all around to find out whether the PDH or PDL are broken or not.
The high and low of day before yesterday are also plotted for reference.
The intraday fib levels get drawn taking present day's high and low into account, useful to mark support/retest levels.
The color of the intraday AUTO FIB high and low lines also change from gray to respective assigned colors once the present day price crosses PDH or PDL this is helpful while viewing charts on mobile app.
Disclaimer: Only for studying price movement ideas, trading is not advised.

Price Action Box RetracementsThe Price Action Box Retracements Indicator offers a fresh perspective on price analysis, departing from the conventional fixed-length lookback period commonly used in trading indicators. This indicator embraces a more flexible and adaptable approach, taking into account changes in price action behavior and avoiding overfitting. With a design philosophy rooted in the principle of "Keep it simple, stupid!" (KISS), this indicator allows users to customize just one variable: Price Box Size.
Imagine the price action as a journey within a box or channel, defined by significant pivots from the past that act as support and resistance levels. The Price Action Box Retracements Indicator visualizes the midpoints between these pivots, representing half-point retracements. By adjusting the "Price Box Size" variable, users can select the size of the price action box that the script will identify on the chart. A larger value will look for a larger box/channel, meaning the price will stay within it for a longer duration. Think of it as switching to a slower timeframe without changing the chart resolution.
The indicator plots a median line within the price action box, which changes color based on the position of the price action within the box. When the price action is trading below the median, the line is displayed in red, indicating a potential for short entries. Conversely, when the price action is above the box median, the line turns green, suggesting opportunities for long entries. An orange color is used when the price action breaks outside the box, signaling the start of a new trend or a measured move where the box size is expected to double.
Sudden changes in the median location are crucial signals that the price action has broken outside its previous box and created a new one. Usually, the price action will attempt to return back and test its old box boundaries or median (support/resistance) before continuing further. If the new box is positioned above the previous one, it indicates an upward channel (uptrend), while a box below the previous one suggests a descending channel (downtrend). A flat median line represents a ranging market, where the price action lacks a clear directional bias.
In addition to the median plot, the script also offers a pivot-anchored moving average, assisting traders in identifying smaller trends and potential entry points within a larger price action box.
Experience a new approach to price analysis with the Price Action Box Retracements Indicator and enhance your trading strategies with simplicity and flexibility.
Auto Fibo Multi Timeframe [Misu]█ This indicator shows a Multi Timeframe automatic Fibonacci retracement levels.
This indicator is built using pivots from a user-selected timeframe to draw and orient the Fibonacci retracement.
Fibonacci analysis uses a logical sequence of numbers to predict trends and price action.
█ Usages:
The Fibonacci retracement is used to identify hidden support and resistance levels that an investor can use for entry, exit, and stop placement.
Depending on your usage, you can track breakouts above and below retracement levels to provide early entry points for major breakouts and breakdowns.
Higher timeframe Fibs allow you to have more relevant and weighted signals.
█ Features:
Choose Timeframe
Choose Fib levels
Color Fib Levels Individually
Color Fib Levels all in one
█ Parameters:
Timeframe: The Timeframe chosen.
Left Bars: A parameter used to calculate pivots.
Right Bars: A parameter used to calculate pivots.
UI Settings: Select Fibs levels and colors.

Auto Fibonacci Retracement - Real-Time (Expo)█ Fibonacci retracement is a popular technical analysis method to draw support and resistance levels. The Fibonacci levels are calculated between 2 swing points (high/low) and divided by the key Fibonacci coefficients equal to 23.6%, 38.2%, 50%, 61.8%, and 100%. The percentage represents how much of a prior move the price has retraced.
█ Our Auto Fibonacci Retracement indicator analyzes the market in real-time and draws Fibonacci levels automatically for you on the chart. Real-time fib levels use the current swing points, which gives you a huge advantage when using them in your trading. You can always be sure that the levels are calculated from the correct swing high and low, regardless of the current trend. The algorithm has a trend filter and shifts the swing points if there is a trend change.
The user can set the preferred swing move to scalping, trend trading, or swing trading. This way, you can use our automatic fib indicator to do any trading. The auto fib works on any market and timeframe and displays the most important levels in real-time for you.
█ This Auto Fib Retracement indicator for TradingView is powerful since it does the job for you in real-time. Apply it to the chart, set the swing move to fit your trading style, and leave it on the chart. The indicator does the rest for you. The auto Fibonacci indicator calculates and plots the levels for you in any market and timeframe. In addition, it even changes the swing points based on the current trend direction, allowing traders to get the correct Fibonacci levels in every trend.
█ How does the Auto Fib Draw the levels?
The algorithm analyzes the recent price action and examines the current trend; based on the trend direction, two significant swings (high and low) are identified, and Fibonacci levels will then be plotted automatically on the chart. If the algorithm has identified an uptrend, it will calculate the Fibonacci levels from the swing low and up to the swing high. Similarly, if the algorithm has identified a downtrend, it will calculate the Fibonacci levels from the swing high and down to the swing low.
█ HOW TO USE
The levels allow for a quick and easy understanding of the current Fibonacci levels and help traders anticipate and react when the price levels are tested. In addition, the levels are often used for entries to determine stop-loss levels and to set profit targets. It's also common for traders to use Fibonacci levels to identify resistance and support levels.
Traders can set alerts when the levels are tested.
-----------------
Disclaimer
Copyright by Zeiierman.
The information contained in my Scripts/Indicators/Ideas/Algos/Systems does not constitute financial advice or a solicitation to buy or sell any securities of any type. I will not accept liability for any loss or damage, including without limitation any loss of profit, which may arise directly or indirectly from the use of or reliance on such information.
All investments involve risk, and the past performance of a security, industry, sector, market, financial product, trading strategy, backtest, or individual's trading does not guarantee future results or returns. Investors are fully responsible for any investment decisions they make. Such decisions should be based solely on an evaluation of their financial circumstances, investment objectives, risk tolerance, and liquidity needs.
My Scripts/Indicators/Ideas/Algos/Systems are only for educational purposes!

Multifib by Dan DormondThis multiple fibonacci allows you to calculate 2 fibonacci retracements at the same time, the one on the right uses the traditional method for an autofibonacci and the one on the left will use a higher point, so you can find areas of confluence where the price has a good possibility of reversing.
Fibonacci retracement levels—stemming from the Fibonacci sequence—are horizontal lines that indicate where support and resistance are likely to occur.
Each level is associated with a percentage. The percentage is how much of a prior move the price has retraced. The Fibonacci retracement levels are 23.6%, 38.2%, 61.8%, and 78.6%. While not officially a Fibonacci ratio, 50% is also used.
The indicator is useful because it can be drawn between any two significant price points, such as a high and a low. The indicator will then create the levels between those two points.
How to use it: Only the important fib levels are marked, to find areas of confluence just look for the places where the lines from the left side fibonacci match with the lines from the right side fibonacci retracement.
If you need the code you can message me.

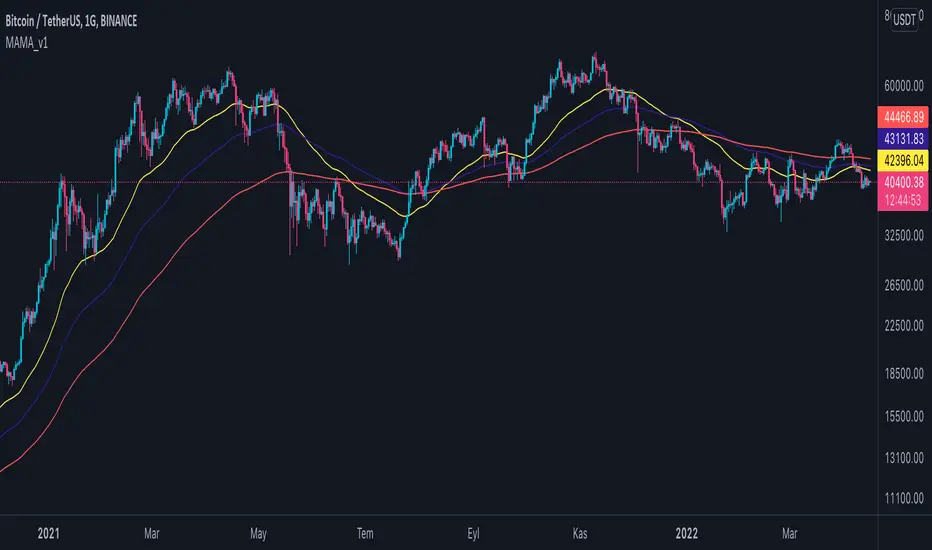
Multi Adjustable Moving Averages(MAMA) with Auto FibonacciMulti Adjustable Moving Averages(MAMA) with Auto Fibonacci
There are 10 moving averages in this indicator. There are 8 different types of moving averages to choose from.
You can also easily set the desired periods, colors and line thicknesses for each moving average from the first page.
It contains Auto Fibonacci as it is used a lot with moving averages. Those who want can easily add from the interface.
Below are the types of moving averages included;
SMA : Simple Moving Average
EMA : Exponential Moving Average
WMA : Weighted Moving Average
TMA : Triangular Moving Average
VAR : Variable Index Dynamic Moving Average a.k.a. VIDYA
WWMA : Welles Wilder's Moving Average
ZLEMA : Zero Lag Exponential Moving Average
TSF : True Strength Force
Alert ;
You can set an alarm on the cross(over or under) of the moving averages you want.
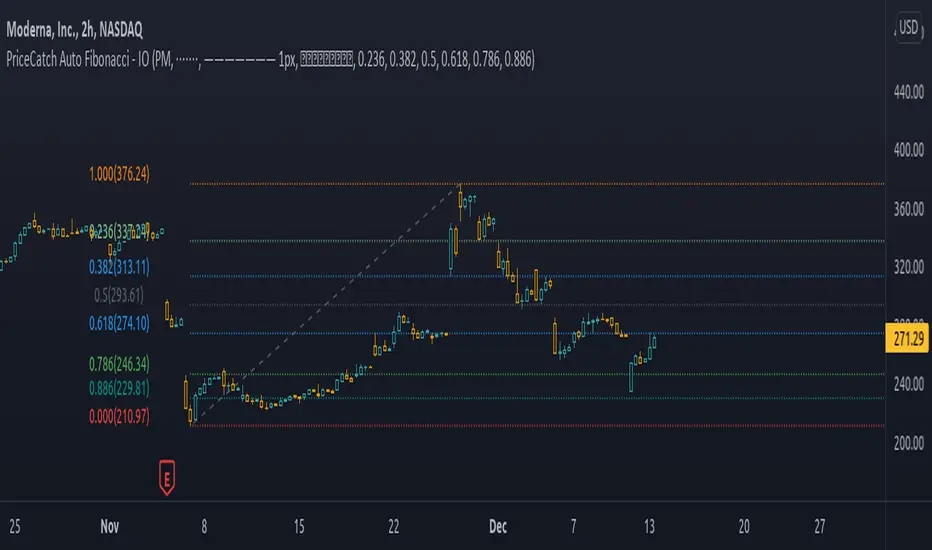
PriceCatch Auto Fibonacci - IOHello and Warm Greetings to Tradingview community.
PriceCatch Auto Fibonacci Levels
The Problem
One of the problems faced by traders who use Fibonacci levels is that they have to draw the levels manually on their charts. It's tedious and sometimes leads to inaccuracies in identifying correct levels.
Secondly, while there are so many Auto Fibonacci scripts available in the Public Scripts Library, most of them are not really useful as they are very limited in their capability for the following reasons:
either they are based on historical bars or historical pivots - user has to enter the number of historical bars or pivots for the starting point of the Fibonacci Levels.
they are time-frame dependent. This is a very serious limitation with most scripts.
they do not offer real and practical user settings.
many of them are not actually pure Fibonacci Levels scripts.
Limitations with other Auto Fibonacci scripts
Other Fibonacci scripts ask user to specify a number of historical bars or pivots to draw the Fibonacci levels. This is a major problem with such scripts - because 50 historical bars on the daily time frame changes to 50 historical bars on the 4H if you change the chart's time-frame to 4H, thereby altering the position of the Fibonacci levels. So, the desired view that the user seeks about price action is not what he/she gets whenever the time-frame changes. Similarly with specifying Pivots. For example, for a swing trader who specifies Pivots, the number of pivots that occur in one month varies depending on the chart's time-frame. So after trying these scripts, users quickly realize that they are not really all that useful.
PriceCatch Auto Fibonacci Levels - Unparalleled advantage
The PriceCatch Auto Fibonacci Levels script that I am publishing is completely different from other Fibonacci scripts on the TradingView Public Library. My script offers users unparalleled flexibility and options to use it effectively and to suit their trading style. With PriceCatch Auto Fibonacci Levels script, user has the ability to choose a variety of options to draw the Fibonacci levels from Current Day, Previous Day all the way up to 52 weeks. Not only that, users can also set their own levels via input options and that makes it even more adaptive to a user's specific needs. So, if you do not want 0.382 level and want the level to be at 0.312, yes, you can do that with this script.
Time-frame independence
This script works independent of the chart time frame and this is it's USP. So, while your chart may be set to 15 minutes time-frame, you can set the script to draw Fibonacci levels of Previous Week, last 3 days or any other available interval of your choice and it will draw it accurately. What's more, you can change your chart's time-frame to any interval of your choice and the Fibonnacci levels stay fixed and true to the chosen option. To my knowledge, none of the other scripts offer such a feature as they are dependent on the Chart's time frame.
The Difference
With the PriceCatch Auto Fibonacci Levels script, when user chooses Previous Month to draw Fibonacci levels, it only considers the high and low of previous month and this can never change. This makes it time-frame independent and actually helpful to the user because while the Fibonacci levels are drawn based on the chosen interval's high and low, user can then choose any chart time frame to trade on the drawn Fibonacci levels. This is the crucial difference and big advantage of PriceCatch Auto Fibonacci Levels script from other scripts.
Chart type independence
PriceCatch Auto Fibonacci Levels script is also independent of chart type. You can set your chart to Bars, Japanese, Hollow, Heikin-Ashi or even line style and this script accurately draws the Fibonacci levels as the logic is independent of chart type.
Practical and really useful
I have written the script after careful study of all the other available scripts and only then took on this project. Once you look at other scripts and what they lack, you will realize my script is all-rounded, very flexible with a wide variety of options to choose from. All of these features make PriceCatch Auto Fibonacci Levels script unique, very powerful and highly useful to traders.
Use Cases
Intraday
If you trade intraday, setting the interval to 3D (3 days) will give you Fibonacci levels of last three days. This may be useful in taking intraday trades by knowing probable support and resistance levels in that period. Then, you can trade on 1 minute, 3 minutes, 5 or any other intraday time frame of your choice.
Swing / Long term trading
For swing or long term traders, setting the interval to PM (previous month) or CQ (current quarter) will help you find probable support / resistance levels in that period that you can use to plan your trades. Then, of course, with the 52W setting, you can take a really long term view of the asset.
Multiple Advantage
Since you can add the script more than once to your chart, you can set one script to a longer time frame and another to a shorter one to form a combination of Fibonacci levels to give you even more precise and desired information about price action and to help you plan/manage your trades.
Some Samples
Tesla with CQ (Current Quarter) setting
Microsoft with CM (Current Month) setting
NVAX Bar Chart in 2H with PM (Previous Month) setting
NOTE - PRIOR TO USING THIS SCRIPT:
Please remember that the script is shared with absolutely no assurances about usability and any warranties whatsoever and as a responsible trader, please satisfy yourselves thoroughly and use it only if you are satisfied it works for you. Remember, you are 100% responsible for your actions. If you understand and accept that, you may use the script.
Why Invite only?
I merely want to know how many traders actually show interest to use it.
QUERIES/FEEDBACK
Please PM me.
I have to thank @BJORGUM for helping me out with this script.
Hope you find this script useful. Wish everyone all the best with trading.
TradeChartist Actuator™TradeChartist Actuator is an extremely functional indicator that converts the price action volatility and momentum into a meaningful trading system (based on user defined Standard Deviation Factor), that consists of expanding/contracting Volatility Range Bands, Dynamic Trend Support/Resistance Bands and 2 types of Breakout Signals in a visually stunning design. The script also neatly packs in ZigZag & manual/automatic Fibonacci Retracement tools, option to filter the signals using an external filter and other useful extras like ™TradeChartist Dollar Candles and much more.
===================================================================================================================
™TradeChartist Actuator User Manual
█ Actuator Range Bands
Actuator Range Bands consists of a Mean line, an Upper Band and a Lower Band which are based on user defined Standard Deviation Factor (Default - 1.618, Min - 0.5, Max - 2). The 1.618 factor works extremely well as the unnecessary volatility data of the bands are eliminated by Actuator's logic. In my personal tests, 1.618 works consistently better than any other value in visually showcasing the true volatility range. By eliminating the unnecessary volatility data from the original non-stabilized bands, Actuator helps detect price momentum by detecting two types of breakouts.
Bands Breakout - Filtered
When the price breaks out of the upper or lower band after a trend, there is a strong possibility of a reversal especially when the volatility expansion/contraction takes place. This is detected using a built in filter with the Filtered Bands Breakout and the user can choose to use the closing price or High/Low price as the trigger for breakouts. This trade setup is very useful especially at zones where the Actuator Range Bands contract or squeeze after an expansion as shown in the OANDA:XAUUSD 1hr chart below.
Also, after a consistent expansion of the bands with price trending in the upper channel or the lower channel, users can spot good profit taking or Short trade opportunities with confirmation of overbought price and if possible a strong bear divergence as show in the BINANCE:LUNAUSDTPERP 1hr chart below.
It can be seen from the chart above that even though Actuator is designed to detect Extreme Bands Breakout using High/Low price, it is done with a little bit of filtering by the script logic and hence didn't generate a Bear signal at the lower band support zone.
Mean Breakout - Filtered
In most Mean Reversion models, mostly oscillators, the mean plays an important role in helping traders predict the price dynamic, but it also presents a challenge whether that mean will act as support or resistance so the trader can take a position that will have a high probability of success. Filtered Mean Breakout helps exactly to identify the price dynamic at the mean zone and helps reduce the dilemma. Actuator uses Volatility Trend and Momentum of the price action at mean to determine Bull/Bear breakouts. Following NASDAQ:AAPL 1hr chart shows an example of 2 instances of Filtered Mean Breakout detection, one bull and one bear and further area where no Breakout was detected in spite of price crossing the mean.
This Breakout type is really helpful in spotting early moves and also reduces the high volatility risk of Extreme Bands Breakout in some cases.
===================================================================================================================
█ External Filter
Actuator breakout signals can be further filtered using the feature of connecting an external signal as a trade filter.
External filter like RSI , MACD etc. can be used to filter breakouts by connecting to ™TradeChartist Actuator under ╔═══ 𝗣𝗹𝘂𝗴 𝗙𝗶𝗹𝘁𝗲𝗿 𝗵𝗲𝗿𝗲 ═══ 🔌 dropdown by enabling 𝐔𝐬𝐞 𝐄𝐱𝐭𝐞𝐫𝐧𝐚𝐥 𝐅𝐢𝐥𝐭𝐞𝐫.
To get the external filter to work, 𝐒𝐢𝐠𝐧𝐚𝐥 𝐓𝐲𝐩𝐞 must be set right. For plots that are non oscillatory like Moving Averages, Super Trend etc., choose type as Non Oscillatory and for Oscillators like RSI , CCI , MACD etc., choose type as Oscillatory .
For Oscillators, levels must be specified for 𝐎𝐬𝐜𝐢𝐥𝐥𝐚𝐭𝐨𝐫 𝐁𝐮𝐥𝐥 𝐅𝐢𝐥𝐭𝐞𝐫 𝐯𝐚𝐥𝐮𝐞 and 𝐎𝐬𝐜𝐢𝐥𝐥𝐚𝐭𝐨𝐫 𝐁𝐞𝐚𝐫 𝐅𝐢𝐥𝐭𝐞𝐫 𝐯𝐚𝐥𝐮𝐞, especially if the Oscillator doesnt have 0 as midline, like RSI . Even for 0 mid oscillators like CCI , filter levels like 100/-100 work effectively to filter noise.
Use 𝐁𝐮𝐥𝐥/𝐁𝐞𝐚𝐫 𝐁𝐚𝐜𝐤𝐠𝐫𝐨𝐮𝐧𝐝 𝐅𝐢𝐥𝐥 under Actuator Visuals section to paint the trade zones background. It helps visually see the effect of filters on the breakout entries and also the trade performance.
The following chart shows the Filter settings with ™TradeChartist Momentum Drift Oscillator connected to Actuator as Oscillatory signal with filter values 0.
The two example charts of 1hr BINANCE:BTCUSDT below shows the difference in Actuator signals based on Oscillatory signal from ™TradeChartist Momentum Drift Oscillator and the difference can be seen from the highlighted Bull/Bear Background Fill.
Without External Filter
With External Filter
===================================================================================================================
█ Dynamic Trend Support/Resistance Bands
In addition to Volatility Range Bands, Actuator also plots Dynamic Trend Support and Resistance bands that are more sensitive to price action and helps the user determine growing support/resistance which is indicated by coloured dots. These dots normally appear when the Support or Resistance stays at the same level for a few bars and change between Bull and Bear colours based on how the price interacts with them as shown below.
===================================================================================================================
█ Useful Trade Tools
™TradeChartist Dollar Candles
Dollar Candles help detect the volatility exhaustion prices and plots $ signs to help the trader take profits or move stop loss levels to secure gains. The $ signs do not appear for every trade zone, but whenever price hits a critical level, it shows up above price bar (for Bull trend) or below price bar (for Bear trend) in real time. Users can also set alerts for Dollar Candles with Once Per Bar setting. The Daily NASDAQ:TSLA chart below shows the Dollar Candles on both Bull and Bear trends.
It is important to note that taking pockets of profits on a leveraged trade position or moving up stop loss to maximize trend gains at $ candles will help increase Average Profitability Per Trade (APPT) .
Bull/Bear Background Fill
Bull/Bear Background Fill paints the trade zones in Bull and Bear colours. This helps visualize the difference in trade zones when testing various settings and also helps analyze past performance of Actuator Signals with or without the use of External Filter.
Entry Stop Loss Reference
Reference zone for stop loss has always been a tricky one for traders. Using a fixed percentage stop at entry may not be best during high volatility moves. Over the extensive period of Actuator testing, a simple solution to this problem was found. The previous trend's Range Bands Mean Line served as a perfect reference point for Entry Stop. Also while analysing this Mean line, it was found to be a perfect horizontal support/resistance line and also helped detect unproductive trades. The example 15m chart of NASDAQ:AMD shows how the Entry Stop Loss Reference performed.
Stop Line Touch Points plot orange touch points on the Stop Line whenever the price hits it during the trade.
Actuator Colour Bars
Actuator Colour Bars paints the Momentum Strength on the price bars. This helps visually see the price bars venturing into the Overbought or the Oversold zones. Also, this feature also helps spot divergences as higher highs or lower lows with less intense Bull/Bear colour than the previous high/low shows diminishing momentum as shown in the 1h chart of OANDA:GBPJPY below.
===================================================================================================================
█ ZigZag & Fibonacci Toolkit
Actuator plots developing and completed ZigZags based on Bull and Bear trend depending on the Breakout Type and Breakout Price from the settings.
Option to enable or disable 𝐙𝐢𝐠𝐙𝐚𝐠 𝐂𝐨𝐧𝐧𝐞𝐜𝐭𝐨𝐫 which can be helpful for Harmonic traders.
Option to display 𝐙𝐢𝐠𝐙𝐚𝐠 𝐇𝐢𝐠𝐡𝐬/𝐋𝐨𝐰𝐬 and 𝐑𝐒𝐈 𝐚𝐭 𝐇𝐢𝐠𝐡𝐬/𝐋𝐨𝐰𝐬 in one of two styles.
Two types of Fibonacci to choose from - 𝐀𝐮𝐭𝐨-𝐅𝐢𝐛𝐬 and 𝐅𝐢𝐛𝐬 𝐛𝐚𝐬𝐞𝐝 𝐨𝐧 𝐋𝐨𝐨𝐤𝐛𝐚𝐜𝐤.
𝐀𝐮𝐭𝐨-𝐅𝐢𝐛𝐬 option plots Auto Fibonacci levels based on Bull/Bear trend depending on user specified Breakout Type and Breakout Price.
𝐅𝐢𝐛𝐬 𝐛𝐚𝐬𝐞𝐝 𝐨𝐧 𝐋𝐨𝐨𝐤𝐛𝐚𝐜𝐤 plots Fibonacci levels based on the highest high and lowest low of the lookback period (𝐃𝐚𝐲𝐬 or 𝐂𝐚𝐧𝐝𝐥𝐞𝐬).
Fibonacci levels can be reversed by enabling 𝐑𝐞𝐯𝐞𝐫𝐬𝐞 from settings.
Enabling 𝐂𝐮𝐫𝐫𝐞𝐧𝐭 𝐏𝐫𝐢𝐜𝐞 𝐅𝐢𝐛 𝐋𝐚𝐛𝐞𝐥 displays the current Fib level of the developing price bar.
Option to customize Fib levels and colours.
4hr chart of BINANCE:BTCUSDT showing Auto Fibonacci levels, Zig-Zag with Trend High/Lows, Zig-Zag connectors with Fib Ratios and RSI at Trend High/Low prices.
Note:
If momentum doesn't slow down, the fibs can extend beyond 1 and may continue way beyond 4.618 fib level. These are quite rare depending on how distant the near high/low is based.
ZigZag and Fibonacci are good reference indicators and should always be used as confirmations rather than standalone indicators.
===================================================================================================================
█ Actuator Colour Scheme
Actuator employs 3 built in colour schemes namely Chilli , Flame and Sublime Grayscale and a versatile colour scheme Custom which enables the user to customise the colour combinations of the components of the Actuator script.
===================================================================================================================
█ Alerts
Alerts can be created for the following.
Actuator Bull Breakout Signal - Once Per Bar Close
Actuator Bear Breakout Signal - Once Per Bar Close
Actuator Long Dollar - Take Profit - Once Per Bar
Actuator Short Dollar - Take Profit - Once Per Bar
Actuator Stop Line Hit - Once Per Bar
Note: The script doesn't repaint, so the alerts can be used with confidence. To check this, users can do bar replays to check if the plots and markers stay in the same place.
===================================================================================================================
Best Practice: Test with different settings first using Paper Trades before trading with real money
===================================================================================================================

Auto Fib Golden Pocket Band - Strategy with Buy Signalsthis strategy is based on the Indicator "Auto Fib Golden Pocket Band - "Autofib Moving Average"
it's the same as the indicator but with:
- the strategy tester included
- several entry Signal filter
- Dynamic SL

TradeChartist ZigZag & Auto Fibonacci Retracement™TradeChartist ZigZag & Auto Fibonacci Retracement is a visually engaging script that generates ZigZag and Auto-Fibonacci lines/labels based on user defined sensitivity factor.
===================================================================================================================
█ ™TradeChartist ZigZag & Auto Fibonacci Retracement Features
=========================================
Plots completed and developing ZigZag based on 𝐙𝐢𝐠𝐙𝐚𝐠/𝐀𝐮𝐭𝐨-𝐅𝐢𝐛𝐬 𝐅𝐚𝐜𝐭𝐨𝐫 (Minimum - 1, Maximum - 10, Default - 5) that adjusts the sensitivity of the ZigZag with 1 being High Sensitivity and 10 being Low Sensitivity.
Option to enable or disable 𝐙𝐢𝐠𝐙𝐚𝐠 𝐂𝐨𝐧𝐧𝐞𝐜𝐭𝐨𝐫 which can be helpful for Harmonic traders.
Option to display 𝐙𝐢𝐠𝐙𝐚𝐠 𝐇𝐢𝐠𝐡𝐬/𝐋𝐨𝐰𝐬 and 𝐑𝐒𝐈 𝐚𝐭 𝐇𝐢𝐠𝐡𝐬/𝐋𝐨𝐰𝐬 in one of two styles.
Two types of Fibonacci to choose from - 𝐀𝐮𝐭𝐨-𝐅𝐢𝐛𝐬 and 𝐅𝐢𝐛𝐬 𝐛𝐚𝐬𝐞𝐝 𝐨𝐧 𝐋𝐨𝐨𝐤𝐛𝐚𝐜𝐤.
𝐀𝐮𝐭𝐨-𝐅𝐢𝐛𝐬 option plots Auto Fibonacci levels based on 𝐙𝐢𝐠𝐙𝐚𝐠/𝐀𝐮𝐭𝐨-𝐅𝐢𝐛𝐬 𝐅𝐚𝐜𝐭𝐨𝐫.
𝐅𝐢𝐛𝐬 𝐛𝐚𝐬𝐞𝐝 𝐨𝐧 𝐋𝐨𝐨𝐤𝐛𝐚𝐜𝐤 plots Fibonacci levels based on the highest high and lowest low of the lookback period (𝐃𝐚𝐲𝐬 or 𝐂𝐚𝐧𝐝𝐥𝐞𝐬).
Fibonacci levels can be reversed by enabling 𝐑𝐞𝐯𝐞𝐫𝐬𝐞 from settings.
Enabling 𝐂𝐮𝐫𝐫𝐞𝐧𝐭 𝐏𝐫𝐢𝐜𝐞 𝐅𝐢𝐛 𝐋𝐚𝐛𝐞𝐥 displays the current Fib level of the developing price bar.
Option to customize Fib levels and colours.
4 Colour themes and option to enable/disable bar colouring.
===================================================================================================================
█ Example charts
1. ZigZag/AutoFibs Factor can make a big difference to ZigZag and AutoFibs plot as shown in the OANDA:XAUUSD Daily chart below.
2. RSI can be quite useful in analysing the Highs and Lows as shown in the BINANCE:BTCUSDT 1hr chart below.
3. Developing or Current Trend means the Low/High is unconfirmed and can move as shown in the OANDA:EURUSD 1hr chart below with bar colouring.
4. Current Price Fib Level label showing PTC means Potential Trend Change. Confirmation at candle close will reverse the Auto-Fibs as shown in BINANCE:ETHUSDT 15m chart below
5. Fibonaci Levels and colours can be customised using 𝐔𝐬𝐞 𝐂𝐮𝐬𝐭𝐨𝐦 𝐅𝐢𝐛 𝐋𝐞𝐯𝐞𝐥𝐬 from the settings as shown in the AMEX:SPY 15m chart below
█ Note:
Rarely, a steep high/low wick doesn't get accounted in the ZigZag High/Low detection as they are filtered using momentum.
If momentum doesn't slow down, the fibs can extend beyond 1 and may continue way beyond 4.618 fib level. These are quite rare depending on how distant the near high/low is based.
ZigZag and Fibonacci are good reference indicators and should always be used as confirmations rather than standalone indicators.
===================================================================================================================
Best Practice: Test with different settings first using Paper Trades before trading with real money
===================================================================================================================

TradeChartist Catalyst™TradeChartist Catalyst is an elegant script that combines Catalyst Trade Bands and automatic ZigZag/Fibonacci plots using an original logic to help users interact in a visually engaging and meaningful way with the charts.
===================================================================================================================
™TradeChartist Catalyst features
=============================
1. Catalyst Trade Bands
Catalyst Trade Bands comprises Equilibrium or Mean Bands, Inner Bands, Outer Bands and a Overall Mean Line. Catalyst Trade Bands help visualize the price action in relation to the Equilibrium Bands and clearly show how far away from the mean the current price is. The Trade Bands are of two types - Normal and Weighted. Weighted Bands are very sensitive to price action and a higher Bands length is recommended.
Simple 144 vs Weighted 144 Trade Bands
2. Equilibrium Touch Points
Every time the price touches the Equilibrium, an orange touch point appears on the chart. Normally, the Equilibrium line, for an optimal sample, acts as support or resistance. Price breaching or failing this line usually signals a Pull Back, a Throw Back or a Trend Change based on how the price interacts with it. This can be used with a secondary confirmation like RSI, Stochastic etc. For example, if the price falls back significantly only to touch the Equilibrium Line and fails to test the Overall Mean Line when Stochastic is below 30, this could mean a strong Pull Back rather than a Trend Change as shown in the example chart below.
When price fails the Equilibrium Bands, the fill colour of the Equilibrium bands changes to Bearish colour. If the Overall Mean line is below the Equilibrium bands and is in a reasonable distance, Mean will act as support as shown in the example below. Price failing the mean will test Inner Bands and strong bear momentum could take price to Outer Bands and beyond.
All the components of the Catalyst Trade Bands including the Touch Points can be enabled or disabled from the settings.
3. ZigZag & Fibonacci
Catalyst automatically plots ZigZag and Auto Fibonacci Retracement based on an intelligent logic and can be tweaked by changing the Zigzag & Auto-Fibs Factor from the settings. It also plots Fib ratios and connectors along with price highs and lows of ZigZag. The ratios can be especially useful to visually detect harmonic patterns and also serves as a useful feature for Fibonacci traders.
4. Fibonacci Customisation
Catalyst users can customise Fibonacci type and levels, including levels colour from Catalyst settings. In addition to Auto-Fibs, users can also plot Fibonacci levels based on Days or Candles lookback. This is a very useful feature if the user wants to override Auto-Fibs to suit his/her needs. Users can also reverse the Fibonacci Levels by enabling Reverse from settings.
In the following example chart of OANDA:USDCAD , Fibonacci levels based on 10 days lookback is plotted.
===================================================================================================================
Best Practice: Test with different settings first using Paper Trades before trading with real money
===================================================================================================================
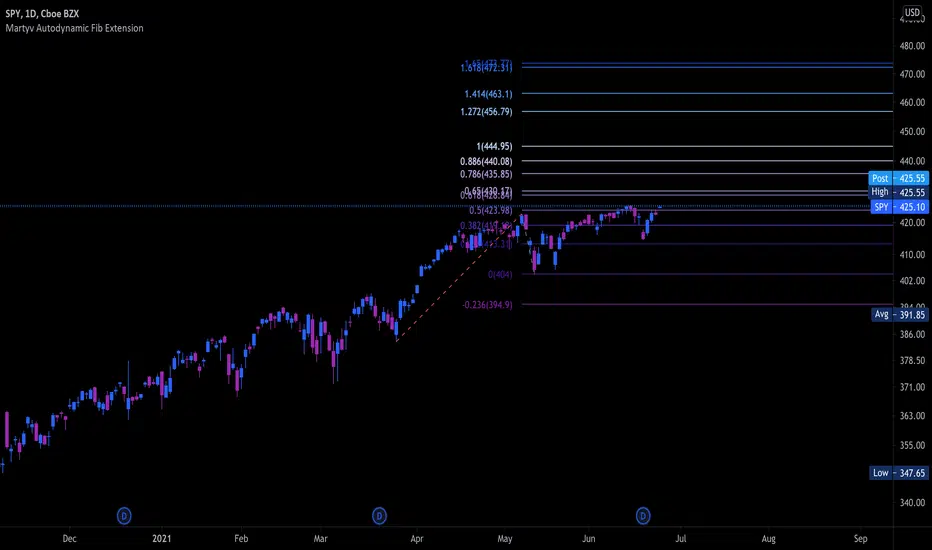
Martyv Auto Fib Extension with Logarithmic SupportSimilar to the Auto Fib Retracement tool - I took the out-of-the-box functionality and added Logarithmic support, as well as nicer colors and easier management of levels. I'm... 90% sure I got the Fib calculations correct. If you see something, say something! Would love any suggestions for improvement.
Martyv Auto Fib Retracement with Logarithmic SupportSimple & easy auto-fib levels. Took the out-of-the-box version provided by TradingView and added Logarithmic support and a nicer palette, and made the controls a bit nicer to use (in my opinion lol). Enjoy.

3 Auto Fibonacci RetracementsThe Indicator displays 3 different Auto Fibonacci Retracements with top, bottom, the 0.618 and 0.382 levels.
Also it displays 3 Moving Averages with the same length as the AutoFibos.
If the MA over the 0.618 level it colors itself yellow, if between 0.618 ans 0.382 white and under 0.382 blue.
The green lines are the top of the AutoFibos, red lines the bottom, blue lines are resistance/supports and yellow lines are stronger resistance/supports.

Auto Fib Extension and RetracementsThis script is used for plotting the Fibonacci support and resistance levels. Compared to other ones, the changes to this script are that you can choose what color should all the lines be and that it doesn't change the chart's size, meaning that it won't shrink the chart so that all the levels can be seen. If you have any suggestions, I'm open to anything.
Also, if you could give a like/comment or if you could follow me, that would do my day. Thank you all and enjoy!