LNL Trend SystemLNL Trend System is an ATR based day trading system specifically designed for intra-day traders and scalpers. The System works on any chart time frame & can be applied to any market. The study consist of two components - the Trend Line and the Stop Line. Trend System is based on a special ATR calculation that is achieved by combining the previous values of the 13 EMA in relation to the ATR which creates a line of deviations that visually look similar to the basic moving average but actually produce very different results ESPECIALLY in sideways market.
Trend Line:
Trend Line is a simple line which is basically a fast gauge represented by the 13 EMA that can change the color based on the current trend structure defined by multiple averages (8,13,21,34 EMAs). Trend Line is there to simply add the confluence for the current trend. Colors of the line are pretty much self-explanatory. Whenever the line turns red it states that the current structure is bearish. Vice versa for green line. Gray line represents neutral market structure.
Stop Line:
Stop Line is an ATR deviaton line with special calculation based on the previous bar ATRs and position of the price in relation to the current and previous values of 13 EMA. As already stated, this creates an ATR deviation marker either above or below the price that trails the price up or down until they touch. Whenever the price comes into the Stop Line it means it is making an ATR expansion move up or down .This touch will usually resolve into a reaction (a bounce) which provides trade opportunities.
Trend Bars:
When turned ON, Trend Bars can provide additional confulence of the current trend alongside with the Trend Line color. Trend Bars are based on the DMI and ADX indicators. Whenever the DMI is bearish and ADX is above 20 the candles paint themselfs red. And vice versa applies for the green candles and bullish DMI. Whenever the ADX falls below the 20, candles are netural (Gray) which means there is no real trend in place at the moment.
Trend Mode:
There are total of 5 different trend modes available. Each mode is visualizing different ATR settings which provides either aggressive or more conservative approach. The more tigher the mode, the more closer the distance between the price and the Stop Line. First two modes were designed for slower markets, whereas the "Loose" and "FOMC" modes are more suitable for products with high volatility.
Trend Modes:
1. Tight
Ideal for the slowest markets. Slowest market can be any market with unusually small average true range values or just simply a market that does have a personality of a "sleeper". Tight Mode can be also used for aggresive entries in the most ridiculous trends. Sometimes price will barely pullback to the Trend Line not even the Stop Line.
2. Normal
Normal Mode is the golden mean between the modes. "Normal" provides the ideal ATR lengths for the most used markets such as S&P Futures (ES) or SPY, AAPL and plenty of other highly popular stocks. More often than not, the length of this mode is respected considering there is no breaking news or high impact market event scheduled.
3. Loose
The "Loose" mode is basically a normal mode but a little bit more loose. This mode is useful whenever the ATRs jump higher than usual or during the days of highly anticipated news events. This mode is also better suited for more active markets such as NQ futures.
4. FOMC
The FOMC mode is called FOMC for a reason. This mode provides the maximum amount of wiggle room between the price and the Stop Line. This mode was designed for the extreme volatility, breaking news events or post-FOMC trading. If the market quiets down, this mode will not get the Stop Line touch as frequently as othete modes, thus it is not very useful to run this on markets with the average volatlity. Although never properly tested, perhaps the FOMC mode can find its value in the crypto market?
5. The Net
The net mode is basically a combination of all modes into one stop line system which creates "the net" effect. The Net provides the widest Stop Line zone which can be mainly appreciated by traders that like to use scale-in scale-out methods for their trading. Not to mention the visual side of the indicator which looks pretty great with the net mode on.
HTF (Higher Time Frame) Trend System:
The system also includes additional higher time frame (HTF) trend system. This can be set to any time frame by manual HTF mode. HTF mode set to "auto" will automatically choose the best suitable higher time frame trend system based on how appropriate the aggregation is. For everything below 5min the HTF Trend System will stay on 5min. Anything between 5-15min = 30min. 30min - 120min will turn on the 240min. 180min and higher will result in Daily time frame. Anything above the Daily will result in Weekly HTF aggregation, above W = Monthly, above M = Quarterly.
Background Clouds:
In terms of visualization, each trend system is fully customizable through the inputs settings. There is also an option to turn on/off the background clouds behind the stop lines. These clouds can make the charts more clean & visible.
Tips & Tricks:
1. Different Trend Modes
Try out different modes in different markets. There is no one single mode that will fit to everyone on the same type of market. I myself actually prefer more Loose than the Normal.
2. Stop Line Mirroring
Whenever the Stop Lines start to mirror each other (there is one above the price and one below) this means the price is entering a ranging sideways market. It does not matter which Stop Line will the price touch first. They can both be faded until one of them flips.
3. Signs of the Ranging Market
Watch out for signs of ranging market. Whenever the Trend System looses its colors whether on trend line or trend bars, if everything turns neutral (gray) that is usually a solid indication of a range type action for the following moments. Also as already stated before, the Stop Line mirroring is a good sign of the range market.
4. Trailing Tool, Trend System as an Additional Study?
In case you are not a fan of the colorful green / red charts & candles. You can switch all of them off and just leave the Stop Line on. This way you can use the benefits of the trend system and still use other studies on top of that. Similarly as the Parabolic SAR is often used.
5. The Flip Setup
One of my favorite trades is the Flip Setup on the 5min charts. Whenever the Stop Line is broken , the very first opposing touch after the Trend System flips is a usually a highly participated touch. If there is a strong reaction, this means this is likely a beginning of a new trend. Once I am in the position i like to trail the Stop Line on the 1min charts.
Hope it helps.
ATR

Buying Selling Volume StrategyFirst I would like to give the original credit and thanks to @ceyhun for his amazing volume script.
The way I decided to convert it into a strategy is divided into multiple types.
First, I decided in order to smooth out the values and make it more accurate to adapt the values to multiple timeframes.
After that I took the initial values from the buyers and sellers , and made a rest operation between them to have a flat difference between the power of both sides.
WIth that later on I decided to to apply a volatility filter,in this case bollinger bands, in order to find out potential leading trends.
At the same time in order to filter even more, I decided to make use as well for weekly VWAP values of the asset used.
Lastly I added a dynamic risk management into it , based on the ATR Daily values of the asset values.
As for the rules used, for example for long, I am looking that the price of the asset is above the weekly VWAP, after that I am checking that the MTF volume rest operation is both bullish and above the upper side of the bollinger.
For short we would want the asset to be below the weekly VWAP, and the volume to be bearish and above the upper side of bollinger.
The exit is either based on daily ATR values multipliers, or if we have a reverse condition.
If you have any questions, please let me know !

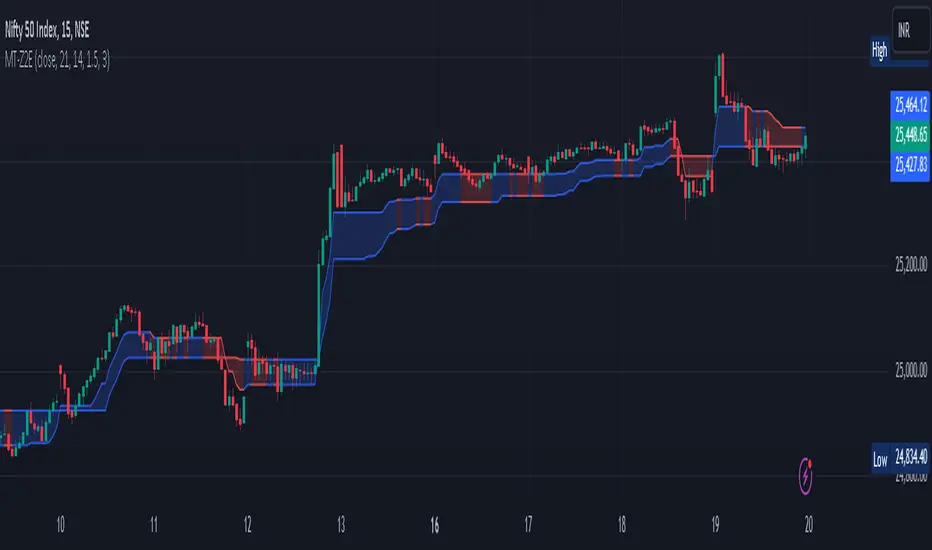
Magic Trend By Market Mindset - Zero To EndlessMagic Trend indicator is an indicator combining the Commodity Channel Index (CCI) and the Average True Range (ATR) indicators.
The indicator is represented by a line that turns red when CCI readings are below 0 and converts to blue when CCI reaches above 0.
Color of the line can be treated as a trend indicator.
When CCI > 0 (Blue Color), price is assumed to be in uptrend and a buying momentum could be seen.
When CCI < 0 (Red Color), price is assumed to be in downtrend and a selling pressure could be seen.
Two Multipliers of ATR have been used. Default values for multiploier are : 1.5 and 3.0
It tells about the volatality in the price and also helps in deciding Entry poits, Stop loss points and sometimes Exit points.
If trend magic lines are not straight and moving upward/downward, continuition of the trend is expected and so Holding the position is adviced.
If the farther line (line with multiplier 3.0) is broken, a trend reversal can be seen soon.
In this case, squaring off and making reverse position is adviced near the other (1.5 mult) line.
If price is revolving in between these two lines... a sideways movement is expected.
Happy Trading
Market Mindset
Auto-Length Adaptive ChannelsIntroduction
The key innovation of the ALAC is the implementation of dynamic length identification, which allows the indicator to adjust to the "market beat" or dominant cycle in real-time.
The Auto-Length Adaptive Channels (ALAC) is a flexible technical analysis tool that combines the benefits of five different approaches to market band and price deviation calculations.
Traders often tend to overthink of what length their indicators should use, and this is the main idea behind this script. It automatically calculates length based on pivot points, averaging the distance that is in between of current market highs and lows.
This approach is very helpful to identify market deviations, because deviations are always calculated and compared to previous market behavior.
How it works
The indicator uses a Detrended Rhythm Oscillator (DRO) to identify the dominant cycle in the market. This length information is then used to calculate different market bands and price deviations. The ALAC combines five different methodologies to compute these bands:
1 - Bollinger Bands
2 - Keltner Channels
3 - Envelope
4 - Average True Range Channels
5 - Donchian Channels
By averaging these calculations, the ALAC produces an overall market band that generalizes the approaches of these five methods into a single, adaptive channel.
How to Use
When the price is at the upper band, this might suggest that the asset is overbought and may be due for a price correction. Conversely, when the price is at the lower band, the asset may be oversold and due for a price increase.
The space between the bands represents the market's volatility. Wider bands indicate higher volatility, while narrower bands suggest lower volatility.
Indicator Settings
The settings of the ALAC allow for customization to suit different trading strategies:
Use Autolength?: This allows the indicator to automatically adjust the length of the dominant cycle.
Usual Length: If "Use Autolength?" is disabled, this setting allows the user to manually specify the length of the cycle.
Moving Average Type: This selects the type of moving average to be used in the calculations. Options include SMA, EMA, ALMA, DEMA, JMA, KAMA, SMMA, TMA, TSF, VMA, VAMA, VWMA, WMA, and ZLEMA.
Channel Multiplier: This adjusts the distance between the bands.
Channel Multiplier Step: This changes the step size of the channel multiplier. Each next market band will be multiplied by a previous one. You can potentially use values below 1, which will plot bands inside the first, main channel.
Use DPO instead of source data?: This setting uses the DPO for calculations instead of the source data. Basically, this is how you can add or eliminate trend from calculation of an average leg-up / leg-down move.
Fast: This adjusts the fast length of the DPO.
Slow: This adjusts the slow length of the DPO.
Zig-zag Period: This adjusts the period of the zig-zag pattern used in the DPO.
(!) For more information about DPO visit official TradingView description here: link
Also, I want to say thanks to @StockMarketCycles for initial idea of Detrended Rhythm Oscillator (DRO) that I use in this script.
The Adaptive Average Channel is a powerful and versatile indicator that combines the strengths of multiple technical analysis methods.
In summary, with the ALAC, you can:
1 - Dynamically adapt to any asset and price action with automatic calculation of dominant cycle lengths.
2 - Identify potential overbought and oversold conditions with the adaptive market bands.
3 - Customize your analysis with various settings, including moving average type and channel multiplier.
4 - Enhance your trading strategy by using the indicator in conjunction with other forms of analysis.

TrendGuard Flag Finder - Strategy [presentTrading]
Introduction and How It Is Different
In the vast world of trading strategies, the TrendGuard Flag Finder stands out as a unique blend of traditional flag pattern detection and the renowned SuperTrend indicator.
- A significant portion of the Flag Pattern detection is inspired by the "Flag Finder" code by @Amphibiantrading, which serves as one of foundational element of this strategy.
- While many strategies focus on either trend-following or pattern recognition, this strategy harmoniously combines both, offering traders a more holistic view of the market.
- The integration of the SuperTrend indicator not only provides a clear direction of the prevailing trend but also offers potential stop-loss levels, enhancing the strategy's risk management capabilities.
AAPL 1D chart
ETHBTC 6hr chart
Strategy: How It Works
The TrendGuard Flag Finder is primarily built on two pillars:
1. Flag Pattern Detection : At its core, the strategy identifies flag patterns, which are continuation patterns suggesting that the prevailing trend will resume after a brief consolidation. The strategy meticulously detects both bullish and bearish flags, ensuring traders can capitalize on opportunities in both rising and falling markets.
What is a Flag Pattern? A flag pattern consists of two main components:
1.1 The Pole : This is the initial strong price move, which can be either upwards (for bullish flags) or downwards (for bearish flags). The pole represents a strong surge in price in a particular direction, driven by significant buying or selling momentum.
1.2 The Flag : Following the pole, the price starts consolidating, moving against the initial trend. This consolidation forms a rectangular shape and is characterized by parallel trendlines. In a bullish flag, the consolidation will have a slight downward tilt, while in a bearish flag, it will have a slight upward tilt.
How the Strategy Detects Flags:
Identifying the Pole: The strategy first identifies a strong price movement over a user-defined number of bars. This movement should meet a certain percentage change to qualify as a pole.
Spotting the Flag: After the pole is identified, the strategy looks for a consolidation phase. The consolidation should be counter to the prevailing trend and should be contained within parallel lines. The depth (for bullish flags) or rally (for bearish flags) of this consolidation is calculated to ensure it meets user-defined criteria.
2. SuperTrend Integration : The SuperTrend indicator, known for its simplicity and effectiveness, is integrated into the strategy. It provides a dynamic line on the chart, signaling the prevailing trend. When prices are above the SuperTrend line, it's an indication of an uptrend, and vice versa. This not only confirms the flag pattern's direction but also offers a potential stop-loss level for trades.
When combined, these components allow traders to identify potential breakout (for bullish flags) or breakdown (for bearish flags) scenarios, backed by the momentum indicated by the SuperTrend.
Usage
To use the SuperTrend Enhanced Flag Finder:
- Inputs : Begin by setting the desired parameters. The strategy offers a range of user-controlled settings, allowing for customization based on individual trading preferences and risk tolerance.
- Visualization : Once the parameters are set, the strategy will identify and visually represent flag patterns on the chart. Bullish flags are represented in green, while bearish flags are in red.
- Trade Execution : When a breakout or breakdown is identified, the strategy provides entry signals. It also offers exit signals based on the SuperTrend, ensuring that traders can capitalize on the momentum while managing risk.
Default Settings
The strategy comes with a set of default settings optimized for general use:
- SuperTrend Parameters: Length set to 10 and Factor set to 5.0.
- Bull Flag Criteria: Max Flag Depth at 7, Max Flag Length at 10 bars, Min Flag Length at 3 bars, Prior Uptrend Minimum at 9%, and Flag Pole Length between 7 to 13 bars.
- Bear Flag Criteria: Similar settings adjusted for bearish patterns.
- Display Options: By default, both bullish and bearish flags are displayed, with breakout and breakdown points highlighted.

DTR & ATR
Description
This ATR and DTR label is update of Existing Label provided by © ssksubam
Please See Notes on original Script Here :
Original Code is not mine but I have done few code changes which I believe will help everyone who are looking to add more labels together and save space on the chart
ATR & DTR Script is very helpful for Day Traders as I will explain in detail bellow
Following are changes I have incorporated
Previous Label took more space on the charts with Header and Footer.
I removed the Header and moved both DTR vs ATR descriptions on the same line, saving space on the chart.
I updated the code to remove => signs, which are self-explanatory as I will explain below.
I made the label in 1 single compact line for maximum space efficiency and aesthetics.
These changes improve the content's clarity and conciseness while optimizing space on the charts. If you have any further requests or need additional assistance, feel free to let me know!
What Does DTR Signify?
Stock ATR stands for Average True Range, which is a technical indicator used in trading and investment analysis. The Average True Range measures the volatility of a stock over a given period of time. It provides insights into the price movement and potential price ranges of the stock.
The ATR is calculated as the average of the true ranges over a specific number of periods. The true range is the greatest of the following three values:
The difference between the current high and the current low.
The absolute value of the difference between the current high and the previous close.
The absolute value of the difference between the current low and the previous close.
Traders and investors use ATR to assess the potential risk and reward of a stock. A higher ATR value indicates higher volatility and larger price swings, while a lower ATR value suggests lower volatility and smaller price movements. By understanding the ATR, traders can set appropriate stop-loss levels and make informed decisions about position sizing and risk management.
It's important to note that the ATR is not a directional indicator like moving averages or oscillators. Instead, it provides a measure of volatility, helping traders adapt their strategies to suit the current market conditions.
What Does ATR Signify?
The Average True Range (ATR) signifies the level of volatility or price variability in a particular financial asset, such as a stock, currency pair, or commodity, over a specific period of time. It provides valuable information to traders and investors regarding the potential risk and reward associated with the asset.
Here are the key significances of ATR:
Volatility Measurement: ATR measures the average price range between high and low prices over a specified timeframe. Higher ATR values indicate greater volatility, while lower values suggest lower volatility. Traders use this information to gauge the potential price movements and adjust their strategies accordingly.
Risk Assessment: A higher ATR value implies larger price swings, indicating increased market uncertainty and risk. Traders can use ATR to set appropriate stop-loss levels and manage risk by adjusting position sizes based on the current volatility.
Trend Strength: ATR can also be used to assess the strength of a trend. In an uptrend or downtrend, ATR tends to increase, indicating a more powerful price movement. Conversely, a declining ATR might signify a weakening trend or a consolidation period.
Range-Bound Market Identification: In a range-bound or sideways market, the ATR value tends to be relatively low, reflecting the lack of significant price movements. This information can be helpful for range-trading strategies.
Volatility Breakouts: Traders often use ATR to identify potential breakouts from consolidation patterns. When the ATR value expands significantly, it may indicate the beginning of a new trend or a breakout move.
Comparison between Assets: ATR allows traders to compare the volatility of different
How to use DTR & ATR for Trading
Using Average True Range (ATR) and Daily Trading Range (DTR) can be beneficial for day trading to assess potential price movements, manage risk, and identify trading opportunities. Here's how you can use both indicators effectively:
Calculate ATR and DTR: First, calculate the ATR and DTR values for the asset you are interested in trading. ATR is the average of true ranges over a specified period (e.g., 14 days), while DTR is the difference between the high and low prices of a single trading day.
Assess Volatility: Compare the ATR and DTR values to understand the current volatility of the asset. Higher values indicate increased volatility, while lower values suggest reduced volatility.
Setting Stop-Loss: Use ATR to set appropriate stop-loss levels. For example, you might decide to set your stop-loss a certain number of ATR points away from your entry point. This approach allows you to factor in market volatility when determining your risk tolerance.
Identify Trading Range: Analyze DTR to determine the typical daily price range of the asset. This information can help you identify potential support and resistance levels, which are essential for day trading strategies such as breakout or range trading.
Breakout Strategies: ATR can assist in identifying potential breakout opportunities. When ATR values increase significantly, it suggests an expansion in volatility, which may indicate an upcoming breakout from a trading range. Look for breakouts above resistance or below support levels with higher than usual ATR values.
Scalping Strategies: For scalping strategies, where traders aim to profit from small price movements within a single trading session, knowing the typical DTR can help set reasonable profit targets and stop-loss levels.
Confirming Trend Strength: In day trading, you may encounter short-term trends. Use ATR to assess the strength of these trends. If the ATR is rising, it suggests a strong trend, while a declining ATR may indicate a weakening trend or potential reversal.
Risk Management: Both ATR and DTR can aid in risk management. Determine your position size based on the current ATR value to align it with your risk tolerance. Additionally, understanding the DTR can help you avoid overtrading during periods of low volatility.
Combine with Other Indicators: ATR and DTR work well when used in conjunction with other technical indicators like moving averages, Bollinger Bands, or RSI. Combining multiple indicators can provide a mor

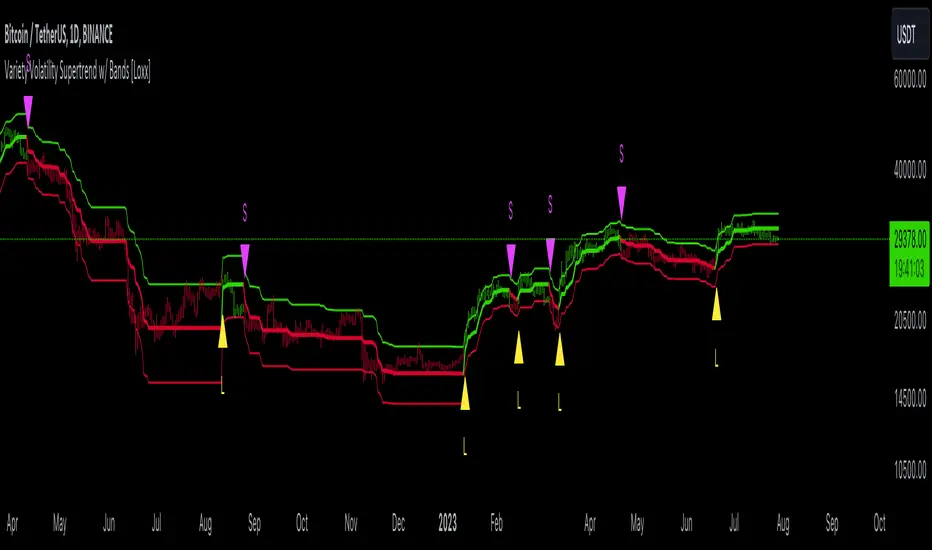
Variety Volatility Supertrend w/ Bands [Loxx]Variety Volatility Supertrend w/ Bands indicator is a powerful and highly customizable tool for traders. Building upon the foundational concept of the classic Supertrend indicator, this variant adds a plethora of user-driven options and features that can cater to diverse trading styles and market scenarios.
The Supertrend indicator is traditionally used to identify market trends by overlaying a line on the price chart, which changes color and position in relation to the price based on the trend direction. The Variety Volatility Supertrend w/ Bands takes this a step further by offering various volatility calculations, visual enhancements, explicit trading signals, and alert conditions.
It provides five options for volatility calculations, enabling users to select the most suitable measure for their strategy. This indicator also allows users to control the display of the upper, lower, and mid bands, which can serve as dynamic support and resistance levels. Further, it can display explicit trading signals when the trend changes direction and set up alerts for these signals.
█ User Inputs
Source: Defines the source of the price data, typically the closing price.
Period: Defines the lookback period for the chosen volatility calculation.
Mid Price Period: Defines the number of periods for calculating the mid-price.
Multiplier: The factor by which the volatility measure (e.g., ATR) is multiplied.
Volatility Type: The user can choose one of five different calculations for the volatility measure: ATR, Standard Error, Standard Deviation, Custom Standard Deviation with Sample Correction, and Custom Standard Deviation without Sample Correction.
Classic Supertrend: Enables the classic version of the Supertrend indicator if set to true.
Show Upper Band, Show Lower Band, Show Mid: Determines whether the upper, lower, and middle bands of the Supertrend indicator are displayed.
Outer Line Width, Mid Line Width: Controls the line widths of the outer and middle lines.
Color Bars: Colors the price bars based on the direction of the trend if enabled.
Show signals: Displays trading signals on the chart if enabled.
Bull Color, Bear Color: Controls the colors of the Supertrend indicator during bullish and bearish market conditions.
█ Computations
The script begins by calculating the chosen volatility measure (ATR, Standard Error, Standard Deviation, etc.) and the mid-price, which is the average of the highest and lowest prices over the specified Mid Price Period. It then calculates the upper and lower bands by adding and subtracting the product of the Multiplier and the volatility measure from the mid-price.
The script then compares the current price with the previous upper and lower bands to determine the trend direction. If the current price is greater than the previous upper band, the trend is considered bullish. If it's less than the previous lower band, the trend is bearish.
█ Visualizations
The script plots the upper, lower, and mid bands on the chart based on the user's settings. If Color Bars is enabled, the script colors the price bars based on the trend direction. If Show signals is enabled, the script displays shapes on the chart to represent trading signals when the trend changes direction.
█ Alerts
Finally, the script sets up alert conditions for long and short trading signals. When these conditions are met, TradingView sends an alert to the user with a message indicating the indicator's name, the type of signal (long or short), and the symbol and closing price of the asset.
█ Visualization Modes
Classic Supertrend
The Classic Supertrend mode essentially transforms the "Variety Volatility Supertrend w/ Bands " indicator to behave more like the traditional Supertrend indicator.
In the traditional Supertrend indicator, there is a single line that shifts positions based on the trend direction. When the market is in an uptrend, the Supertrend line is plotted below the price, acting as a dynamic support level. Conversely, when the market is in a downtrend, the Supertrend line moves above the price, acting as a dynamic resistance level.
When you set Classic Supertrend to True in this script, it mimics this behavior. It will only display one line (the Supertrend line) instead of the upper and lower bands. The Supertrend line will switch between the calculated upper band and lower band based on the trend direction:
In an uptrend, it plots the lower band as the Supertrend line (acting as a dynamic support level).
In a downtrend, it plots the upper band as the Supertrend line (acting as a dynamic resistance level).
Thus, when Classic Supertrend is True, the display is similar to the regular Supertrend indicator, offering a more simplified, less cluttered view of the price trend.
See here for the Classic Supertrend
Supertrend Moving Average with Bands
When the Classic Supertrend option is turned off in the "Variety Volatility Supertrend w/ Bands " indicator, the indicator displays upper and lower bands along with the midline, depending on the user's settings. These bands can serve as dynamic support and resistance levels, and they move and adjust based on the market's volatility.
Support and resistance are key concepts in technical analysis. Support is a price level where the price tends to find a floor as it falls, indicating a greater amount of demand or buying interest that can prop up the prices. Resistance, on the other hand, is a price level where rising prices tend to stop rising, indicating a greater amount of supply or selling interest.
In the context of the "Variety Volatility Supertrend w/ Bands " indicator:
Upper Band: This can act as a dynamic resistance level in a downtrend. When prices are falling, they might struggle to rise above this band. If prices do break above the upper band, it could be a sign that the downtrend is reversing, and a new uptrend may be beginning.
Lower Band: Conversely, this can act as a dynamic support level in an uptrend. When prices are rising, they might bounce off this band and continue to rise. If prices break below the lower band, it could indicate that the uptrend is reversing, and a new downtrend may be beginning.
The benefit of these dynamic support and resistance levels is that they adjust automatically as market conditions change, potentially offering more relevant insights into price behavior compared to static support and resistance levels.
See here for the Supertrend Moving Average with Bands
█ Volatility Types
The "Variety Volatility Supertrend w/ Bands " indicator provides five options for the volatility calculation. Volatility is a statistical measure of the dispersion of returns for a given security or market index. In most cases, the higher the volatility, the riskier the security. Here's a quick summary of each option:
Average True Range (ATR): This is a common volatility measure in the world of trading, particularly for commodities and forex markets. It measures the average of true price ranges over a specified period. The true range considers the most recent period's high-low range, the previous close to the most recent high, and the previous close to the most recent low, taking the highest value.
Standard Error: This is a measure of the accuracy of predictions made with statistical techniques. In the context of trading, the standard error can give traders an idea of the quality of their volatility or price level estimates. It's calculated using the standard deviation of the price data, the square root of the number of data points.
Standard Deviation: This is a measure of the dispersion of a set of data from its mean. It's a commonly used volatility measure in finance. In trading, a higher standard deviation suggests greater price volatility.
Custom Standard Deviation - with Sample Correction: This is a variation of the standard deviation calculation, but it applies a correction for small sample sizes. It's calculated similarly to the standard deviation, but the sum of the squares is divided by (n-1) instead of n to provide a more accurate estimate when working with a small number of data points.
Custom Standard Deviation - without Sample Correction: This is another variation of the standard deviation calculation, but without the sample correction. This might be used when the number of data points is sufficiently large that the correction is not necessary.
The choice of volatility measure can have a significant impact on the sensitivity of the Supertrend indicator. Some measures may result in wider bands and fewer trend changes, while others may produce narrower bands and more frequent trend changes. The choice of volatility measure should align with the trader's strategy and risk tolerance.
█ Multiple Timeframe options
The "Variety Volatility Supertrend w/ Bands " indicator, like most indicators on the TradingView platform, can be applied to various timeframes, regardless of the chart's current timeframe. The timeframe of an indicator is determined by the timeframe of the price data it processes.
This indicator's flexibility with timeframes allows it to be used in different trading strategies. Day traders might use shorter timeframes like 1-minute or 15-minute charts, swing traders might use 1-hour or 4-hour charts, and long-term investors might use daily or weekly charts.
See here for the Supertrend Moving Average with Bands on 4-hour chart using Daily data
ATR Extension [QuantVue]The Moving Average ATR Extension Indicator offers a powerful blend of two key market elements: the Average True Range (ATR) and Moving Averages (MA), capturing the dynamics of market momentum and trend direction.
This indicator is used to measure market extension from a user-selected moving average based on multiples of the Average True Range (ATR). By doing this, it becomes remarkably straightforward to spot strength at breakout points or exhaustion near the end of a run.
As a market breaks out the extension indicates a surge in buying pressure, while an extension after a sizeable move can often be an indication of market exhaustion. This extended position essentially reflects over-enthusiastic buying and could be an early warning sign of a potential trend reversal.
Breakout Strength:
Exhaustion:
Give this indicator a BOOST and COMMENT your thoughts!
We hope you enjoy.
Cheers.

[tradinghook] - Renko Trend Reversal Strategy - Renko Trend Reversal Strategy
Short Title: - Renko TRS
Description:
The Renko Trend Reversal Strategy ( - Renko TRS) is a powerful and original trading approach designed to identify trend reversals in financial markets using Renko charts. Renko charts differ from traditional time-based charts, as they focus solely on price movements and ignore time, resulting in a clearer representation of market trends. This strategy leverages Renko charts in conjunction with the Average True Range (ATR) to capture trend reversals with high precision and effectiveness.
Key Concepts:
Renko Charts: Renko charts are unique chart types that only plot price movements beyond a predefined brick size, ignoring time and noise. By doing so, they provide a more straightforward depiction of market trends, eliminating insignificant price fluctuations and making it easier to spot trend reversals.
Average True Range (ATR): The strategy utilizes the ATR indicator, which measures market volatility and provides valuable insights into potential price movements. By setting the brick size of the Renko chart based on the ATR, the strategy adapts to changing market conditions, ensuring optimal performance across various instruments and timeframes.
How it Works:
The Renko Trend Reversal Strategy is designed to identify trend reversal points and generate buy or sell signals based on the following principles:
Renko Brick Generation: The strategy calculates the ATR over a user-defined period (ATR Length) and utilizes this value to determine the size of Renko bricks. Larger ATR values result in bigger bricks, capturing higher market volatility, while smaller ATR values create smaller bricks for calmer market conditions.
Buy and Sell Signals: The strategy generates buy signals when the Renko chart's open price crosses below the close price, indicating a potential bullish trend reversal. Conversely, sell signals are generated when the open price crosses above the close price, suggesting a bearish trend reversal. These signals help traders identify potential entry points to capitalize on market movements.
Stop Loss and Take Profit Management: To manage risk and protect profits, the strategy incorporates dynamic stop-loss and take-profit levels. The stop-loss level is calculated as a percentage of the Renko open price, ensuring a fixed risk amount for each trade. Similarly, the take-profit level is set as a percentage of the Renko open price to secure potential gains.
How to Use:
Inputs: Before using the strategy, traders can customize several parameters to suit their trading preferences. These inputs include the ATR Length, Stop Loss Percentage, Take Profit Percentage, Start Date, and End Date. Adjusting these settings allows users to optimize the strategy for different market conditions and risk tolerances.
Chart Setup: Apply the - Renko TRS script to your desired financial instrument and timeframe on TradingView. The Renko chart will dynamically adjust its brick size based on the ATR Length parameter.
Buy and Sell Signals: The strategy will generate green "Buy" labels below bullish reversal points and red "Sell" labels above bearish reversal points on the Renko chart. These labels indicate potential entry points for long and short trades, respectively.
Risk Management: The strategy automatically calculates stop-loss and take-profit levels based on the user-defined percentages. Traders can ensure proper risk management by using these levels to protect their capital and secure profits.
Backtesting and Optimization: Before implementing the strategy live, traders are encouraged to backtest it on historical data to assess its performance across various market conditions. Adjust the input parameters through optimization to find the most suitable settings for specific instruments and timeframes.
Conclusion:
The - Renko Trend Reversal Strategy is a unique and versatile tool for traders looking to identify trend reversals with greater accuracy. By combining Renko charts and the Average True Range (ATR) indicator, this strategy adapts to market dynamics and provides clear entry and exit signals. Traders can harness the power of Renko charts while effectively managing risk through stop-loss and take-profit levels. Before using the strategy in live trading, backtesting and optimization will help traders fine-tune the parameters for optimal performance. Start exploring trend reversals with the - Renko TRS and take your trading to the next level.
(Note: This description is for illustrative purposes only and does not constitute financial advice. Traders are advised to thoroughly test the strategy and exercise sound risk management practices when trading in real markets.)

CCI+EMA Strategy with Percentage or ATR TP/SL [Alifer]This is a momentum strategy based on the Commodity Channel Index (CCI), with the aim of entering long trades in oversold conditions and short trades in overbought conditions.
Optionally, you can enable an Exponential Moving Average (EMA) to only allow trading in the direction of the larger trend. Please note that the strategy will not plot the EMA. If you want, for visual confirmation, you can add to the chart an Exponential Moving Average as a second indicator, with the same settings used in the strategy’s built-in EMA.
The strategy also allows you to set internal Stop Loss and Take Profit levels, with the option to choose between Percentage-based TP/SL or ATR-based TP/SL.
The strategy can be adapted to multiple assets and timeframes:
Pick an asset and a timeframe
Zoom back as far as possible to identify meaningful positive and negative peaks of the CCI
Set Overbought and Oversold at a rough average of the peaks you identified
Adjust TP/SL according to your risk management strategy
Like the strategy? Give it a boost!
Have any questions? Leave a comment or drop me a message.
CAUTIONARY WARNING
Please note that this is a complex trading strategy that involves several inputs and conditions. Before using it in live trading, it is highly recommended to thoroughly test it on historical data and use risk management techniques to safeguard your capital. After backtesting, it's also highly recommended to perform a first live test with a small amount. Additionally, it's essential to have a good understanding of the strategy's behavior and potential risks. Only risk what you can afford to lose .
USED INDICATORS
1 — COMMODITY CHANNEL INDEX (CCI)
The Commodity Channel Index (CCI) is a technical analysis indicator used to measure the momentum of an asset. It was developed by Donald Lambert and first published in Commodities magazine (now Futures) in 1980. Despite its name, the CCI can be used in any market and is not just for commodities. The CCI compares current price to average price over a specific time period. The indicator fluctuates above or below zero, moving into positive or negative territory. While most values, approximately 75%, fall between -100 and +100, about 25% of the values fall outside this range, indicating a lot of weakness or strength in the price movement.
The CCI was originally developed to spot long-term trend changes but has been adapted by traders for use on all markets or timeframes. Trading with multiple timeframes provides more buy or sell signals for active traders. Traders often use the CCI on the longer-term chart to establish the dominant trend and on the shorter-term chart to isolate pullbacks and generate trade signals.
CCI is calculated with the following formula:
(Typical Price - Simple Moving Average) / (0.015 x Mean Deviation)
Some trading strategies based on CCI can produce multiple false signals or losing trades when conditions turn choppy. Implementing a stop-loss strategy can help cap risk, and testing the CCI strategy for profitability on your market and timeframe is a worthy first step before initiating trades.
2 — AVERAGE TRUE RANGE (ATR)
The Average True Range (ATR) is a technical analysis indicator that measures market volatility by calculating the average range of price movements in a financial asset over a specific period of time. The ATR was developed by J. Welles Wilder Jr. and introduced in his book “New Concepts in Technical Trading Systems” in 1978.
The ATR is calculated by taking the average of the true range over a specified period. The true range is the greatest of the following:
The difference between the current high and the current low.
The difference between the previous close and the current high.
The difference between the previous close and the current low.
The ATR can be used to set stop-loss orders. One way to use ATR for stop-loss orders is to multiply the ATR by a factor (such as 2 or 3) and subtract it from the entry price for long positions or add it to the entry price for short positions. This can help traders set stop-loss orders that are more adaptive to market volatility.
3 — EXPONENTIAL MOVING AVERAGE (EMA)
The Exponential Moving Average (EMA) is a type of moving average (MA) that places a greater weight and significance on the most recent data points.
The EMA is calculated by taking the average of the true range over a specified period. The true range is the greatest of the following:
The difference between the current high and the current low.
The difference between the previous close and the current high.
The difference between the previous close and the current low.
The EMA can be used by traders to produce buy and sell signals based on crossovers and divergences from the historical average. Traders often use several different EMA lengths, such as 10-day, 50-day, and 200-day moving averages.
The formula for calculating EMA is as follows:
Compute the Simple Moving Average (SMA).
Calculate the multiplier for weighting the EMA.
Calculate the current EMA using the following formula:
EMA = Closing price x multiplier + EMA (previous day) x (1-multiplier)
STRATEGY EXPLANATION
1 — INPUTS AND PARAMETERS
The strategy uses the Commodity Channel Index (CCI) with additional options for an Exponential Moving Average (EMA), Take Profit (TP) and Stop Loss (SL).
length : The period length for the CCI calculation.
overbought : The overbought level for the CCI. When CCI crosses above this level, it may signal a potential short entry.
oversold : The oversold level for the CCI. When CCI crosses below this level, it may signal a potential long entry.
useEMA : A boolean input to enable or disable the use of Exponential Moving Average (EMA) as a filter for long and short entries.
emaLength : The period length for the EMA if it is used.
2 — CCI CALCULATION
The CCI indicator is calculated using the following formula:
(src - ma) / (0.015 * ta.dev(src, length))
src is the typical price (average of high, low, and close) and ma is the Simple Moving Average (SMA) of src over the specified length.
3 — EMA CALCULATION
If the useEMA option is enabled, an EMA is calculated with the given emaLength .
4 — TAKE PROFIT AND STOP LOSS METHODS
The strategy offers two methods for TP and SL calculations: percentage-based and ATR-based.
tpSlMethod_percentage : A boolean input to choose the percentage-based method.
tpSlMethod_atr : A boolean input to choose the ATR-based method.
5 — PERCENTAGE-BASED TP AND SL
If tpSlMethod_percentage is chosen, the strategy calculates the TP and SL levels based on a percentage of the average entry price.
tp_percentage : The percentage value for Take Profit.
sl_percentage : The percentage value for Stop Loss.
6 — ATR-BASED TP AND SL
If tpSlMethod_atr is chosen, the strategy calculates the TP and SL levels based on Average True Range (ATR).
atrLength : The period length for the ATR calculation.
atrMultiplier : A multiplier applied to the ATR to set the SL level.
riskRewardRatio : The risk-reward ratio used to calculate the TP level.
7 — ENTRY CONDITIONS
The strategy defines two conditions for entering long and short positions based on CCI and, optionally, EMA.
Long Entry: CCI crosses below the oversold level, and if useEMA is enabled, the closing price should be above the EMA.
Short Entry: CCI crosses above the overbought level, and if useEMA is enabled, the closing price should be below the EMA.
8 — TP AND SL LEVELS
The strategy calculates the TP and SL levels based on the chosen method and updates them dynamically.
For the percentage-based method, the TP and SL levels are calculated as a percentage of the average entry price.
For the ATR-based method, the TP and SL levels are calculated using the ATR value and the specified multipliers.
9 — EXIT CONDITIONS
The strategy defines exit conditions for both long and short positions.
If there is a long position, it will be closed either at TP or SL levels based on the chosen method.
If there is a short position, it will be closed either at TP or SL levels based on the chosen method.
Additionally, positions will be closed if CCI crosses back above oversold in long positions or below overbought in short positions.
10 — PLOTTING
The script plots the CCI line along with overbought and oversold levels as horizontal lines.
The CCI line is colored red when above the overbought level, green when below the oversold level, and white otherwise.
The shaded region between the overbought and oversold levels is plotted as well.

Average True Range Trailing Mean [Alifer]Upgrade of the Average True Range default indicator by TradingView. It adds and plots a trailing mean to show periods of increased volatility more clearly.
ATR TRAILING MEAN
A trailing mean, also known as a moving average, is a statistical calculation used to smooth out data over time and identify trends or patterns in a time series.
In our indicator, it clearly shows when the ATR value spikes outside of it's average range, making it easier to identify periods of increased volatility.
Here's how the ATR Trailing Mean (atr_mean) is calculated:
atr_mean = ta.cum(atr) / (bar_index + 1) * atr_mult
The ta.cum() function calculates the cumulative sum of the ATR over all bars up to the current bar.
(bar_index + 1) represents the number of bars processed up to the current bar, including the current one.
By dividing the cumulative ATR ta.cum(atr) by (bar_index + 1) and then multiplying it by atr_mult (Multiplier), we obtain the ATR Trailing Mean value.
If atr_mult is set to 1.0, the ATR Trailing Mean will be equal to the simple average of the ATR values, and it will follow the ATR's general trend.
However, if atr_mult is increased, the ATR Trailing Mean will react more strongly to the ATR's recent changes, making it more sensitive to short-term fluctuations.
On the other hand, reducing atr_mult will make the ATR Trailing Mean less responsive to recent changes in ATR, making it smoother and less prone to reacting to short-term volatility.
In summary, adjusting the atr_mult input allows traders to fine-tune the ATR Trailing Mean's responsiveness based on their preferred level of sensitivity to recent changes in market volatility.
IMPLEMENTATION IN A STRATEGY
You can easily implement this indicator in an existing strategy, to only enter positions when the ATR is above the ATR Trailing Mean (with Multiplier-adjusted sensitivity). To do so, add the following lines of codes.
Under Inputs:
length = input.int(title="Length", defval=20, minval=1)
atr_mult = input.float(defval=1.0, step = 0.1, title = "Multiplier", tooltip = "Adjust the sensitivity of the ATR Trailing Mean line.")
smoothing = input.string(title="Smoothing", defval="RMA", options= )
ma_function(source, length) =>
switch smoothing
"RMA" => ta.rma(source, length)
"SMA" => ta.sma(source, length)
"EMA" => ta.ema(source, length)
=> ta.wma(source, length)
This will allow you to define the Length of the ATR (lookback length over which the ATR is calculated), the Multiplier to adjust the Trailing Mean's sensitivity and the type of Smoothing to be used for the ATR.
Under Calculations:
atr= ma_function(ta.tr(true), length)
atr_mean = ta.cum(atr) / (bar_index+1) * atr_mult
This will calculate the ATR based on Length and Smoothing, and the resulting ATR Trailing Mean.
Under Entry Conditions, add the following to your existing conditions:
and atr > atr_mean
This will make it so that entries are only triggered when the ATR is above the ATR Trailing Mean (adjusted by the Multiplier value you defined earlier).
ATR - DEFINITION AND HISTORY
The Average True Range (ATR) is a technical indicator used to measure market volatility, regardless of the direction of the price. It was developed by J. Welles Wilder and introduced in his book "New Concepts in Technical Trading Systems" in 1978. ATR provides valuable insights into the degree of price movement or volatility experienced by a financial asset, such as a stock, currency pair, commodity, or cryptocurrency, over a specific period.
ATR - CALCULATION AND USAGE
The ATR calculation involves three components:
1 — True Range (TR): The True Range is a measure of the asset's price movement for a given period. It takes into account the following factors:
The difference between the high and low prices of the current period.
The absolute value of the difference between the high price of the current period and the closing price of the previous period.
The absolute value of the difference between the low price of the current period and the closing price of the previous period.
Mathematically, the True Range (TR) for the current period is calculated as follows:
TR = max(high - low, abs(high - previous_close), abs(low - previous_close))
2 — ATR Calculation: The ATR is calculated as a Moving Average (MA) of the True Range over a specified period.
The ATR is calculated as follows:
ATR = MA(TR, length)
3 — ATR Interpretation: The ATR value represents the average volatility of the asset over the chosen period. Higher ATR values indicate higher volatility, while lower ATR values suggest lower volatility.
Traders and investors can use ATR in various ways:
Setting Stop Loss and Take Profit Levels: ATR can help determine appropriate stop-loss and take-profit levels in trading strategies. A larger ATR value might require wider stop-loss levels to allow for the asset's natural price fluctuations, while a smaller ATR value might allow for tighter stop-loss levels.
Identifying Market Volatility: A sharp increase in ATR might indicate heightened market uncertainty or the potential for significant price movements. Conversely, a decreasing ATR might suggest a period of low volatility and possible consolidation.
Comparing Volatility Between Assets: Since ATR uses absolute values, it shouldn't be used to compare volatility between different assets, as assets with higher prices will consistently have higher ATR values, while assets with lower prices will consistently have lower ATR values. However, the addition of a trailing mean makes such a comparison possible. An asset whose ATR is consistently close to its ATR Trailing Mean will have a lower volatility than an asset whose ATR continuously moves far above and below its ATR Trailing Mean. This can help traders and investors decide which markets to trade based on their risk tolerance and trading strategies.
Determining Position Size: ATR can be used to adjust position sizes, taking into account the asset's volatility. Smaller position sizes might be appropriate for more volatile assets to manage risk effectively.

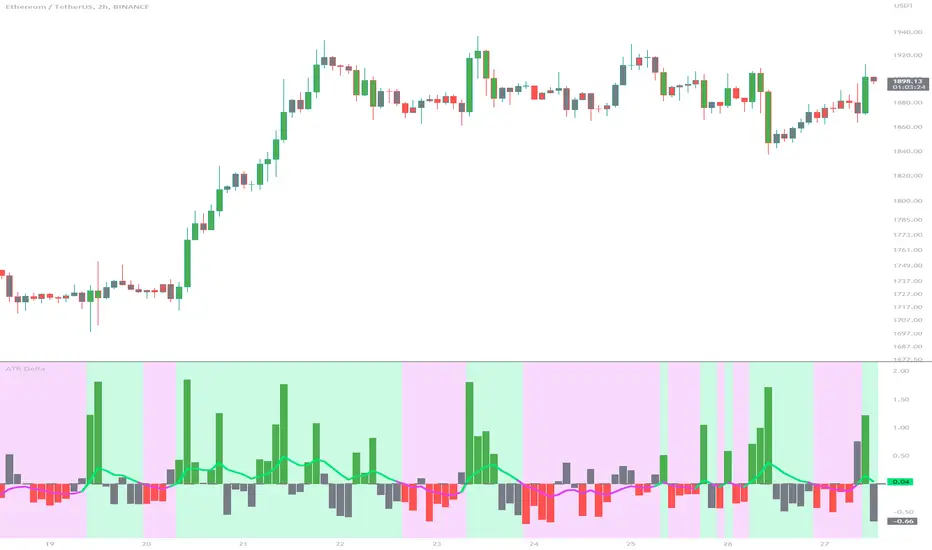
Buyers & Sellers / RangeBuyers & Sellers / Range
Volatility oscillator that measures the relationship of Buying & Selling Pressure to True Range.
In other words, how much % Buyers and Sellers separately occupy the Bar
BSP is a part of Bar Range. Entire bar metrics will always have bigger value than its composite elements (body and wicks).
Since there will be NO chance of BP or SP being more than ATR, their ratio would serve crucial Volatility details.
Hence, we can relate each of them to the overall range.
As a result we have simultaneous measurements of proportions buyers and sellers to the bar.
Default mode shows BP/ATR and SP/ATR mirrored. When one rises, the other falls to compensate.
Buying Pressure / True Range ⬆️🟢 ⬇️🔵
Selling Pressure / True Range ⬆️🔴 ⬇️🟠
They are being averaged in 2 different ways:
Pre-average first, then relate as ratio
Related first, then Averaged
Enable "Preaveraged" to use already averaged BSP and Ranges in ratio instead of averaging the ratio of BSP to individual bar. For example, we're looking BP/ATR, in calculation of buyers / Range it will use "MA(Buying Pressure) / MA(True Range)" instead of "MA(Buying Pressure / True Range)".
Due such calculation, it is going to be more lagging than in off mode. Nevertheless, it reduces noise from the impact of individual bar change.
Second way of noise reduction is enabling "Body / Range"
BSP Body / Range where Bullish & Bearish Body = Buying & Selling Pressure - Relevant Wick
Buying Body = Buying Pressure - Lower Wick
Selling Body = Selling Pressure - Upper Wick
And only then it is divided to ATR.
Note that Balance line differs because body is less than it used to be with wicks. So change in wicks won't play any role in computing the ratio anymore. Thus, signals of their crossings will be more reliable than in default mode.

ATR InfoWhat Is the Average True Range (ATR)?
The average true range (ATR) is a technical analysis indicator, introduced by market technician J. Welles Wilder Jr. in his book New Concepts in Technical Trading Systems, that measures market volatility by decomposing the entire range of an asset price for that period.
Each instrument per unit of time passes its average value of the true range, but there are moments when the volatility explodes or abruptly decays, these phenomena introduce large distortions into the average value of the true range.
The ATR_WPB function calculates the average value of the true range for the specified number of bars, while excluding paranormally large and paranormally small bars from the calculation of the average.
For example, if the instrument has passed a small ATR value, then it has many chances to continue moving, but if the instrument has passed its ATR value, then the chances of continuing to move are extremely low.

ATR_InfoWhat Is the Average True Range (ATR)?
The average true range (ATR) is a technical analysis indicator, introduced by market technician J. Welles Wilder Jr. in his book New Concepts in Technical Trading Systems, that measures market volatility by decomposing the entire range of an asset price for that period.
Each instrument per unit of time passes its average value of the true range, but there are moments when the volatility explodes or abruptly decays, these phenomena introduce large distortions into the average value of the true range.
The ATR_WPB function calculates the average value of the true range for the specified number of bars, while excluding paranormally large and paranormally small bars from the calculation of the average.
For example, if the instrument has passed a small ATR value, then it has many chances to continue moving, but if the instrument has passed its ATR value, then the chances of continuing to move are extremely low.
Library "ATR_Info"
ATR_Info: Calculates ATR without paranormal bars
ATR_WPB(source, period, psmall, pbig)
ATR_WPB: Calculates ATR without paranormal bars
Parameters:
source (float) : ATR_WPB: (series float) The sequence of data on the basis of which the ATP calculation will be made
period (int) : ATR_WPB: (int) Sequence size for ATR calculation
psmall (float) : ATR_WPB: (float) Coefficient for paranormally small bar
pbig (float) : ATR_WPB: (float) Coefficient for paranormally big bar
Returns: ATR_WPB: (float) ATR without paranormal bars

Price Legs: Average Heights; 'Smart ATR'Price Legs: Average Heights; 'Smart ATR'. Consol Range Gauge
~~ Indicator to show small and large price legs (based on short and long input pivot lengths), and calculating the average heights of these price legs; counting legs from user-input start time ~~
//Premise: Wanted to use this as something like a 'Smart ATR': where the average/typical range of a distinct & dynamic price leg could be calculated based on a user-input time interval (as opposed to standard ATR, which is simply the average range over a consistent repeating period, with no regard to market structure). My instinct is that this would be most useful for consolidated periods & range trading: giving the trader an idea of what the typical size of a price leg might be in the current market state (hence in the title, Consol Range gauge)
//Features & User inputs:
-Start time: confirm input when loading indicator by clicking on the chart. Then drag the vertical line to change start time easily.
-Large Legs (toggle on/off) and user-input pivot lookback/lookforward length (larger => larger legs)
-Small Legs (toggle on/off) and user-input pivot lookback/lookforward length (smaller => smaller legs)
-Display Stats table: toggle on/off: simple view- shows the averages of large (up & down), small (up & down), and combined (for each).
-Extended stats table: toggle on/off option to show the averages of the last 3 legs of each category (up/down/large/small/combined)
-Toggle on/off Time & Price chart text labels of price legs (time in mins/hours/days; price in $ or pips; auto assigned based on asset)
-Table position: user choice.
//Notes & tips:
-Using custom start time along with replay mode, you can select any arbitrary chunk of price for the purpose of backtesting.
-Play around with the pivot lookback lengths to find price legs most suitable to the current market regime (consolidating/trending; high volatility/ low volatility)
-Single bar price legs will never be counted: they must be at least 2 bars from H>>L or L>>H.
//Credits: Thanks to @crypto_juju for the idea of applying statistics to this simple price leg indicator.
Simple View: showing only the full averages (counting from Start time):
View showing ONLY the large legs, with Time & Price labels toggled ON:

Multi-Band Breakout IndicatorThe Multi-Band Breakout Indicator was created to help identify potential breakout opportunities in the market. It combines multiple bands (ATR-Based and Donchian) and moving averages to provide valuable insights into the underlying trend and potential breakouts. By understanding the calculations, interpretation, parameter adjustments, potential applications, and limitations of the indicator, traders can effectively incorporate it into their trading strategy.
Calculation:
The indicator utilizes several calculations to plot the bands and moving averages. The length parameter determines the period used for the Average True Range (ATR), which measures volatility. A higher length captures a longer-term view of price movement, while a lower length focuses on shorter-term volatility. The multiplier parameter adjusts the distance of the upper and lower bands from the ATR. A higher multiplier expands the bands, accommodating greater price volatility, while a lower multiplier tightens the bands, reflecting lower volatility. The MA Length parameter determines the period for the moving averages used to calculate the trend and trend moving average. A higher MA Length creates a smoother trend line, filtering out shorter-term fluctuations, while a lower MA Length provides a more sensitive trend line.
The Donchian calculations in the Multi-Band Breakout Indicator play a significant role in identifying potential breakout opportunities and providing additional confirmation for trading signals. In this indicator, the Donchian calculations are applied to the trend line, which represents the average of the upper and lower bands. To calculate the Donchian levels, the indicator uses the Donchian Length parameter, which determines the period over which the highest high and lowest low are calculated. A longer Donchian Length captures a broader price range, while a shorter length focuses on more recent price action. By incorporating the Donchian calculations into the Multi-Band Breakout Indicator, traders gain an additional layer of confirmation for breakout signals.
Interpretation:
The Multi-Band Breakout Indicator offers valuable interpretation for traders. The upper and lower bands represent dynamic levels of resistance and support, respectively. These bands reflect the potential price range within which the asset is expected to trade. The trend line is the average of these bands and provides a central reference point for the overall trend. When the price moves above the upper band, it suggests a potential overbought condition and a higher probability of a pullback. Conversely, when the price falls below the lower band, it indicates a potential oversold condition and an increased likelihood of a bounce. The trend moving average further smooths the trend line, making it easier to identify the prevailing direction.
The crossover of the trend line (representing the average of the upper and lower bands) and the trend moving average holds a significant benefit for traders. This crossover serves as a powerful signal for potential trend changes and breakout opportunities in the market. When the trend line crosses above the trend moving average, it suggests a shift in momentum towards the upside, indicating a potential bullish trend. This provides traders with an early indication of a possible upward movement in prices. Conversely, when the trend line crosses below the trend moving average, it indicates a shift in momentum towards the downside, signaling a potential bearish trend. This crossover acts as an early warning for potential downward price movement. By identifying these crossovers, traders can capture the initial stages of a new trend, enabling them to enter trades at favorable entry points and potentially maximize their profit potential.
Breakout Signals:
For bullish breakouts, the indicator looks for a bullish crossover between the trend line and the trend moving average. This crossover suggests a shift in momentum towards the upside. Additionally, it checks if the current price has broken above the upper band and the previous Donchian high. This confirms that the price is surpassing a previous resistance level, indicating further upward movement.
For bearish breakouts, the indicator looks for a bearish crossunder between the trend line and the trend moving average. This crossunder indicates a shift in momentum towards the downside. It also checks if the current price has broken below the lower band and the previous Donchian low. This confirms that the price is breaking through a previous support level, signaling potential downward movement.
When a bullish or bearish breakout is detected, it suggests a potential trading opportunity. Traders may consider initiating positions in the direction of the breakout, anticipating further price movement in that direction. However, it's important to remember that breakouts alone do not guarantee a successful trade. Other factors, such as market conditions, volume, and confirmation from additional indicators, should be taken into account. Risk management techniques should also be implemented to manage potential losses.
Coloration:
The coloration in the Multi-Band Breakout Indicator is used to visually represent different aspects of the indicator and provide valuable insights to traders. Let's break down the coloration components:
-- Trend/Basis Color : The tColor variable determines the color of the bars based on the relationship between the trend line (trend) and the closing price (close), as well as the relationship between the trend line and the trend moving average (trendMA). If the trend line is above the closing price and the trend moving average is also above the closing price, the bars are colored fuchsia, indicating a potential bullish trend. If the trend line is below the closing price and the trend moving average is also below the closing price, the bars are colored lime, indicating a potential bearish trend. If neither of these conditions is met, the bars are colored yellow, representing a neutral or indecisive market condition.
-- Moving Average Color : The maColor variable determines the color of the filled area between the trend line and the trend moving average. If the trend line is above the trend moving average, the area is filled with a lime color with 70% opacity, indicating a potential bullish trend. Conversely, if the trend line is below the trend moving average, the area is filled with a fuchsia color with 70% opacity, indicating a potential bearish trend. This coloration helps traders visually identify the relationship between the trend line and the trend moving average.
-- highColor and lowColor : The highColor and lowColor variables determine the colors of the high Donchian band (hhigh) and the low Donchian band (llow), respectively. These bands represent dynamic levels of resistance and support. If the highest point in the previous Donchian period (hhigh) is above the upper band, the highColor is set to olive with 90% opacity, indicating a potential resistance level. On the other hand, if the lowest point in the previous Donchian period (llow) is below the lower band, the lowColor is set to red with 90% opacity, suggesting a potential support level. These colorations help traders quickly identify important price levels and assess their significance in relation to the bands.
By incorporating coloration, the Multi-Band Breakout Indicator provides visual cues to traders, making it easier to interpret the relationships between various components and assisting in identifying potential trend changes and breakout opportunities. Traders can use these color cues to quickly assess the prevailing market conditions and make informed trading decisions.
Adjusting Parameters:
The Multi-Band Breakout Indicator offers flexibility through parameter adjustments. Traders can customize the indicator based on their preferences and trading style. The length parameter controls the sensitivity to price changes, with higher values capturing longer-term trends, while lower values focus on shorter-term price movements. By adjusting the parameters, such as the ATR length, multiplier, Donchian length, and MA length, traders can customize the indicator to suit different timeframes and trading strategies. For shorter timeframes, smaller values for these parameters may be more suitable, while longer timeframes may require larger values.
Potential Applications:
The Multi-Band Breakout Indicator can be applied in various trading strategies. It helps identify potential breakout opportunities, allowing traders to enter trades in the direction of the breakout. Traders can use the indicator to initiate trades when the price moves above the upper band or below the lower band, confirming a potential breakout and providing a signal to enter a trade. Additionally, the indicator can be combined with other technical analysis tools, such as support and resistance levels, candlestick patterns, or trend indicators, to increase the probability of successful trades. By incorporating the Multi-Band Breakout Indicator into their trading approach, traders can gain a better understanding of market trends and capture potential profit opportunities.
Limitations:
While the Multi-Band Breakout Indicator is a useful tool, it has some limitations that traders should consider. The indicator performs best in trending markets where price movements are relatively strong and sustained. During ranging or choppy market conditions, the indicator may generate false signals, leading to potential losses. It is crucial to use the indicator in conjunction with other analysis techniques and risk management strategies to enhance its effectiveness. Additionally, traders should consider external factors such as market news, economic events, and overall market sentiment when interpreting the signals generated by the indicator.
By combining multiple bands and moving averages, this indicator offers valuable insights into the underlying trend and helps traders make informed trading decisions. With customization options and careful interpretation, this indicator can be a valuable addition to any trader's toolkit, assisting in identifying potential breakouts, capturing profitable trades, and enhancing overall trading performance.

Stop loss and position size calculator (ATR)Calculates and plots Stop Loss and Position Size, based on desired ATR factor.
Displays Stop Loss Price, SL Distance Percent and Position Size overlayed in the chart and plots a stop loss line.
Additionally Stop Loss, ATR, SL Distance and Position Size are also displayed in the Data Window.
Available settings:
Trade - long / short
ATR timeframe - Allows to use ATR based on different timeframe than the current chart.
ATR factor - Stop Loss will be calculated by multiplying ATR with this factor.
Show last - Amount of previous stop loss lines to plot
Line Offset - Positions previous sl calculation under/above current price.
Calculation Offset - Displays calculation based on price action of previous bar(s).
Label Display Distance - Defines position of label relative to current bar.
Risk - Amount you are going to risk if stop loss is hit.

Webby's Tight IndicatorWebby's Tight Indicator is used to measure a securities volatility relative to itself over time. This is achieved by taking the average of three short term ATR's (average true range) and creating a ratio versus three longer term ATR's.
Mike Webster recently stated he is using the 3,5,8 for the short term ATR's and the 55,89,144 for the long term ATR's. All of the ATR lengths are part of the Fibonacci sequence.
The ratio of the ATR's is then calculated and plotted as a histogram with 0 representing the ATR's being equal. As a stocks short term ATR contracts the histogram will rise above 0 meaning volatility in the short term is contracting relative to long term volatility. On the other hand if the short ATR's are expanding versus the long term ATR's the histogram will fall below 0 and turn red, signifying short term volatility is greater than long term volatility.
The easy visualization of this indicator allows you to quickly see when a stock is in a tight range and could be ready for a potential breakout to the long side or breakdown to the short side.
In this example we see tight price action with a blue histogram followed by volatility to the upside coinciding with a breakout.
In this example we see volatility expanding as a stock continues to fall.
To help differentiate between trending contraction or expansion and just short term blips 5-day exponential moving average of the ratio is also plotted on the histogram and dynamically changes colors as it rises and falls.
Indicator options include:
Change histogram colors
Choose ema line width

Price Exhaustion IndicatorThe Price Exhaustion Indicator (PE) is a powerful tool designed to identify trends weakening and strengthening in the financial markets. It combines the concepts of Average True Range (ATR), Moving Average Convergence Divergence (MACD), and Stochastic Oscillator to provide a comprehensive assessment of trend exhaustion levels. By analyzing these multiple indicators together, traders and investors can gain valuable insights into potential price reversals and long-term market highs and lows.
The aim of combining the ATR, MACD, and Stochastic Oscillator, is to provide a comprehensive analysis of trend exhaustion. The ATR component helps assess the volatility and range of price movements, while the MACD offers insights into the convergence and divergence of moving averages. The Stochastic Oscillator measures the current price in relation to its range, providing further confirmation of trend exhaustion. The exhaustion value is derived by combining the MACD, ATR, and Stochastic Oscillator. The MACD value is divided by the ATR value, and then multiplied by the Stochastic Oscillator value. This calculation results in a single exhaustion value that reflects the combined influence of these three indicators.
Application
The Price Exhaustion Indicator utilizes a unique visual representation by incorporating a gradient color scheme. The exhaustion line dynamically changes color, ranging from white when close to the midline (40) to shades of purple as it approaches points of exhaustion (overbought at 100 and oversold at -20). As the exhaustion line approaches the color purple, this represents extreme market conditions and zones of weakened trends where reversals may occur. This color gradient serves as a visual cue, allowing users to quickly gauge the strength or weakness of the prevailing trend.
To further enhance its usability, the Price Exhaustion Indicator also includes circle plots that signify potential points of trend reversion. These plots appear when the exhaustion lines cross or enter the overbought and oversold zones. Red circle plots indicate potential short entry points, suggesting a weakening trend and the possibility of a downward price reversal. Conversely, green circle plots represent potential long entry points, indicating a strengthening trend and the potential for an upward price reversal.
Traders and investors can leverage the Price Exhaustion Indicator in various ways. It can be utilized as a trend-following tool, or a mean reversion tool. When the exhaustion line approaches the overbought or oversold zones, it suggests a weakening trend and the possibility of a price reversal, helping identify potential market tops and bottoms. This can guide traders in timing their entries or exits in anticipation of a trend shift.
Utility
The Price Exhaustion Indicator is particularly useful for long-term market analysis, as it focuses on identifying long-term market highs and lows. By capturing the gradual weakening or strengthening of a trend, it assists investors in making informed decisions about portfolio allocation, trend continuation, or potential reversals.
In summary, the Price Exhaustion Indicator is a comprehensive and visually intuitive tool that combines ATR, MACD, and Stochastic Oscillator to identify trend exhaustion levels. By utilizing a gradient color scheme and circle plots, it offers traders and investors valuable insights into potential trend reversals and long-term market highs and lows. Its unique features make it a valuable addition to any trader's toolkit, providing a deeper understanding of market dynamics and assisting in decision-making processes. Please note that future performance of any trading strategy is fundamentally unknowable, and past results do not guarantee future performance.

Webby's RSI 2.0Webby's RSI (Really Simple Indicator) 2.0 or version 5.150 as Mike himself calls it, builds upon the original Webby RSI by changing the way we measure extension from the 21-day exponential moving average.
Instead using the percentage of the low versus the 21-day exponential moving average, version 2 uses a multiple of the securities 50 day ATR (average true range) to determine the extension.
Version 2.0 also comes with some new additions, such as measuring the high vs 21-day exponential moving average when a security is below it, as well as an ATR extension from the 10-day simple moving average that Mike looks to as a guide to take partials.
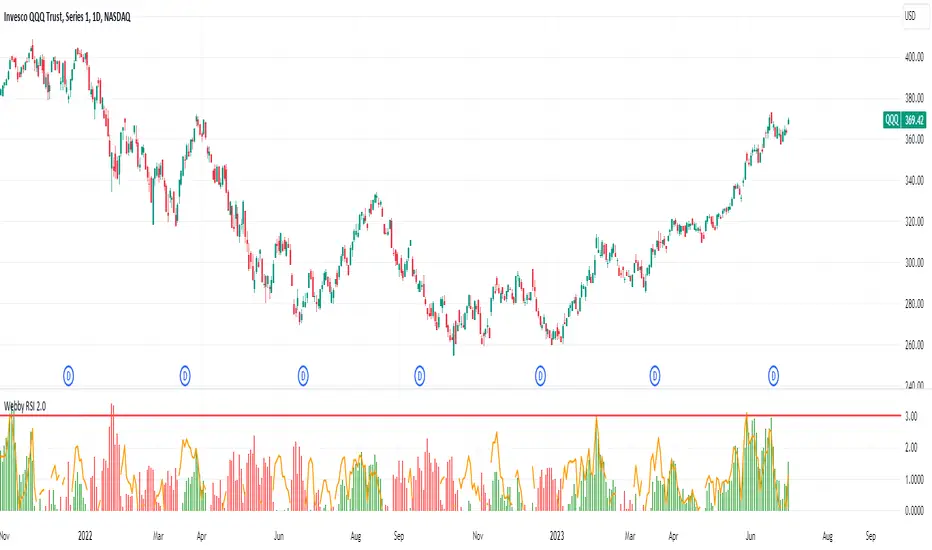
AIR Vortex ADXThis project started as an effort to improve the user interface of the hybrid indicator ADX of Vortex, which is, as per the name, a blend of ADX and Vortex Indicator. Plotting both indicators on the same polarity and normalising the vortex, a better interpretation of the interaction between the two is possible, and trend becomes apparent.
Basically, the Vortex provides the bright punch and ADX the continuation of the trend and momentum.
A range mixer has been added to the vortex, comprising both true and interpercentile ranges (see my previous script for a desrciption of interpercentile range). Users can activate and add amounts of each as they see fit.
Finally, there is an RSI filter, the idea of which is to filter out ranging (flat) markets, where no distinct direction is yet emerging.
ATR profit and loss linesWhat is ATR?
Taking a candlestick, the following 3 transactions are calculated:
1-The difference between the high of the day and the low of the day
2-The difference between today's high and yesterday's close
3-The difference between today's low and yesterday's close
Atr takes the average of these 14-day candlesticks after making their calculations and it predicts how high or low a candle can go and these give us support and resistance helps with points
If you have noticed a rise in your chart and have no idea how high it will go, you can use Atr profit and loss lines.
The red zone is the stop point, the blue zones are the snow zones.
Must be used with macd. macd is validator.
There is an increase in your chart, you opened the atr profit and loss lines upwards and if macd gives you an increase, it is recommended that you enter the trade at that time. It is recommended to increase your loss line 1 step in the direction of profit every 2 profit breaks on atr profit and loss lines.
ATR Nedir?
Bir mum barı ele alınarak şu 3 işlem hesaplanır:
1-Günün yükseği ile günün düşüğü farkı
2-Günün yükseği ile dünün kapanışının farkı
3-Günün düşüğü ile dünkü kapanışın farkı
ATR ise 14 günlük bu mum barlarının hesaplarını yaptıktan sonra ortalamasını alır ve bir mumum ne kadar yükselip düşebileceği konusunda tahmin verir ve bunlar bize destek ve direnç noktaları konusunda yardımcı olur
Eğer grafiğinizde bir yükseliş farketmişseniz ne kadar yükseleceği konusunda fikriniz yoksa Atr kar zarar çizgilerini kullanabilirsiniz.
Kırmızı bölge durdurma noktası,mavi bölgeler kar bölgeleridir.
Macd ile birlikte kullanılmalıdır.macd doğrulayıcıdır.
Grafiğinizde yükseliş var,atr kar zarar çizgilerini yukarı yönlü açtınız ve macd size yükseliş veriyorsa işte o sırada işleme girmeniz tavsiye edilir.atr kar zarar çizgilerinde her 2 kar kırılımında bir zarar çizginizi kar yönünde 1 kademe arttırmanız önerilir

ATR DeltaThe ATR Delta indicator is based on the concept of Average True Range (ATR), which reflects the average price range over a specified period. By calculating the difference between current and previous ATR values, the ATR Delta provides valuable insights into volatility shifts in the market. This information can help traders identify periods of heightened or diminished price movement, enabling them to adjust their strategies accordingly.
The ATR Delta indicator consists of two main calculations:
-- ATR Calculation : The Average True Range (ATR) is calculated using the specified length parameter. It measures the average price range (including gaps) during that period. A larger ATR value indicates higher volatility, while a smaller value indicates lower volatility.
-- ATR Delta Calculation : The ATR Delta is calculated by subtracting the ATR value of the previous bar from the current ATR value. This calculation captures the change in volatility between the two periods, providing a measure of how volatility has evolved.
Positive ATR Delta values indicate an increase in volatility compared to the previous period. It suggests that price movements have expanded, potentially indicating a more active market. On the other hand, negative ATR Delta values indicate a decrease in volatility compared to the previous period. It suggests that price movements have contracted, potentially signaling a calmer or range-bound market.
The ATR Delta indicator uses coloration to visually represent the relationship between the ATR Delta, zero, and a signal line:
-- Green color is assigned when the ATR Delta is positive, above the signal line, and increasing. This coloration suggests a scenario of higher volatility, as the market is experiencing upward momentum in price swings.
-- Red color is assigned when the ATR Delta is negative, below the signal line, and decreasing. This coloration suggests a scenario of lower volatility, as the market is experiencing downward momentum in price swings.
-- Gray color is assigned for other cases when the ATR Delta and signal line relationship does not meet the above conditions.
These colors are reflected in the columns of the ATR Delta as well as the bar coloration.
The ATR Delta indicator includes a signal line, which acts as a reference for interpreting the ATR Delta values. The signal line is calculated as a moving average (EMA) of the ATR Delta over a specified length. It helps smooth out the ATR Delta fluctuations, providing a clearer indication of the underlying trend in volatility changes. When the ATR Delta crosses above the signal line, it may suggest a potential increase in volatility, indicating a market that is becoming more active. Conversely, when the ATR Delta crosses below the signal line, it may suggest a potential decrease in volatility, indicating a market that is becoming less active.
The coloration of the signal line in the ATR Delta indicator helps to differentiate between positive and negative values and provides further insight into market sentiment. When the signal line is positive, indicating increasing volatility, it is colored lime. This color choice reinforces the bullish sentiment and signifies potential opportunities for trend continuation or breakouts. On the other hand, when the signal line is negative, indicating decreasing volatility, it is colored fuchsia. This color choice highlights the bearish sentiment and suggests potential range-bound or consolidation periods. These colors are reflected in the background of the indicator.
The ATR Delta indicator offers several potential applications for traders:
-- Volatility Analysis : The ATR Delta is invaluable for understanding and analyzing volatility dynamics in the market. Traders can observe the changes in ATR Delta values and use them to assess the current level of price movement. This information can help determine the appropriate strategies and risk management approaches.
-- Breakout Strategies : Traders often use the ATR Delta to identify periods of increased volatility, which frequently accompany breakouts. By monitoring the ATR Delta, traders can anticipate potential price breakouts and adjust their entry and exit levels accordingly.
-- Trend Confirmation : Combining the ATR Delta with trend-following indicators allows traders to validate the strength of a trend. Higher ATR Delta values during an uptrend may indicate stronger momentum and a higher likelihood of continuation. Conversely, lower ATR Delta values during a downtrend may suggest a potential consolidation phase or trend reversal.
Limitations :
-- Lagging Indicator : The ATR Delta indicator is based on historical data and calculates the difference between current and previous ATR values. As a result, it may lag behind real-time market conditions. Traders should be aware of this delay and consider it when making trading decisions. It is advisable to combine the ATR Delta with other indicators or price action analysis for a more comprehensive assessment of market conditions.
-- Parameter Sensitivity : The ATR Delta indicator's effectiveness can be influenced by the selection of its parameters, such as the length of the ATR and signal line. Different market conditions may require adjustments to these parameters to better capture volatility changes. Traders should carefully test and optimize the indicator's parameters to align with the characteristics of the specific market or asset they are trading.
-- Market Regime Changes : The ATR Delta indicator assumes that volatility changes occur gradually. However, in rapidly changing market regimes or during news events, volatility can spike or drop abruptly, potentially rendering the indicator less effective. Traders should exercise caution and consider using additional tools or techniques to identify and adapt to such market conditions.
The ATR Delta indicator is a valuable tool for traders seeking to analyze and monitor volatility dynamics in the market. By calculating the difference between current and previous ATR values, it provides insights into changes in price movement and helps identify periods of increased or decreased volatility. Traders can leverage the ATR Delta to fine-tune their strategies, validate trend strength, and identify potential breakout opportunities. However, it is essential to recognize the limitations of the indicator, including its lagging nature and sensitivity to parameter selection. By combining the ATR Delta with other technical analysis tools and applying sound risk management practices, traders can enhance their decision-making process and potentially improve their trading outcomes.