[RESEARCH] Heikin-Ashi Chart IdentifierA deterministic approach to identify Heikin-Ashi chart type.
The script checks the next statements about HA:
HA chart does not have any gaps in a classic sense
Every new HA open price is calculated using a specific recurrence formula. This fact also means that initial HA open price is used to calculate all the next and so on (a construction of Infinite Impulse Response filters)
The script works correctly being applied to other chart types:
Classic Candlestick
Range Bars
Line Break
Traditional Renko
ATR Renko
Traditional Point-and-Figure
ATR Point-and-Figure
Kagi
For special ones: this code allows you to check whether your script is being executed with Heikin-Ashi candles or not inside your script.
Ev sistr 'ta Laou!
Ashi

DH: True-Price DOTS for Heikin AshiTrue-Price DOTS for Heikin Ashi (open/close/current)
USE:
Must Set Tradingview Candle Type to Heikin Ashi.
Works on all Timeframes and symbols.
BENEFITS:
Helps keep you aware of the actual price action as you trade and historically by adding subtle DOTS and step-lines over your Heikin Ashi candles. With this indicator, you can benefit from the price averaging and smoothing effects of Heikin Ashi while benefiting from the accuracy of traditional candles and true active price levels. Helps maximize your buy and sell entries and exits.
HOW IT WORKS:
Adds true-price DOTS (showing current-price & close)
Adds STEP-LINE (showing true open) price level to Heikin Ashi candles.
DOTS will move & update on active candle with current price movement (as candle forms) . This is beneficial for accurate entry and exits during candle development period.
Option (on/off) to add current True-Price LINE (blue line) in input settings (recommended) .
NOTE:
You may need to right-click candles and arrange "visual order" so that DOTS are on top layer of chart. Otherwise some DOTS might hide behind candles.
ENJOY!
Dan Hollings
Master Crypto Grid Trader
Host of the "High Leverage Lounge"
Please Explore My Other Indicators, Scripts, Grids and Educational Ideas.
@DanHollings on Tradingview

HTF Candle [Custom Time Period] by JustUncleL [SOMMI 1.0 edit]This is a custom High Time Frame indicator, originally created by JustUncleL. 💚
I have edited the Pine Script to allow a custom Time Period input. 💛
In the original version, you could only select from a few time periods as your High Time Frame. 💙
In this version you can put any time frame as your reference. 🧡
Example: 6-hour HTF or 2-Day HTF
SOMMI'S SPECIAL NOTES:
-This indicator works with Heikin-Ashi candles.
-Please change your candles to Heikin-Ashi and apply the indicator.
-Advised to disable "Body Wicks"
-Advised to also refresh your page a few times a day as it doesn't update properly due to limitations of TradingView / Pinescript currently.
💙💛💚🧡


Momentum DivergenceTrading Divergence based on Momentum (Indicator below), If you want to make this a strategy i would use all those indicators above for extra confirmation.
"Momentum Divergence" indicator includes the following:
-"Momentum Waves" (blue waves)
-"Stochastic RSI" color change (green/red lines)
-"RSI" (purple line)
-"Money Flow Index" (green/red bar below)
-"Volume Weighted Average Price" ( (yellow/red areas ) (not included yet, but i will include it soon))
Green/Red circles added for possible trend Reversals
Alerts can be set on those Green/Red circles
How to Trade:
Draw Divergence between waves as shown on the chart for LONG/SHORT position (From a Big Wave to a small Wave ... The big Wave MUST be above Blue line in order to draw a divergence line (60 Threshold))
When to Sell:
There is no specific way to exit but with support/resistance zones will help to exit position AND the other indicators will help too (DONT GET GREEDY)
More info:
Since this is a combination of oscillators it should work in any time frame.
-MUST use Heikin Ashi candles.
Coming updates:
-Include VWAP
-Automatic draws divergence between HH HL LH LL waves with pine script version @4

HTF Heikin AshiThis script colors standard candles or bars according to the Heikin Ashi trend at that time. (Timeframe is adjustable)
tips are always welcome at: 38uGQJDDZDL6wX48x4gYTccPeQ3ZHVYmY4 (btc)
I hope you enjoy the script :)

Heiken Ashi Line MTFThis scripts requests Heiken-Ashi on different time frames and plots their values on the chart on your current time frame

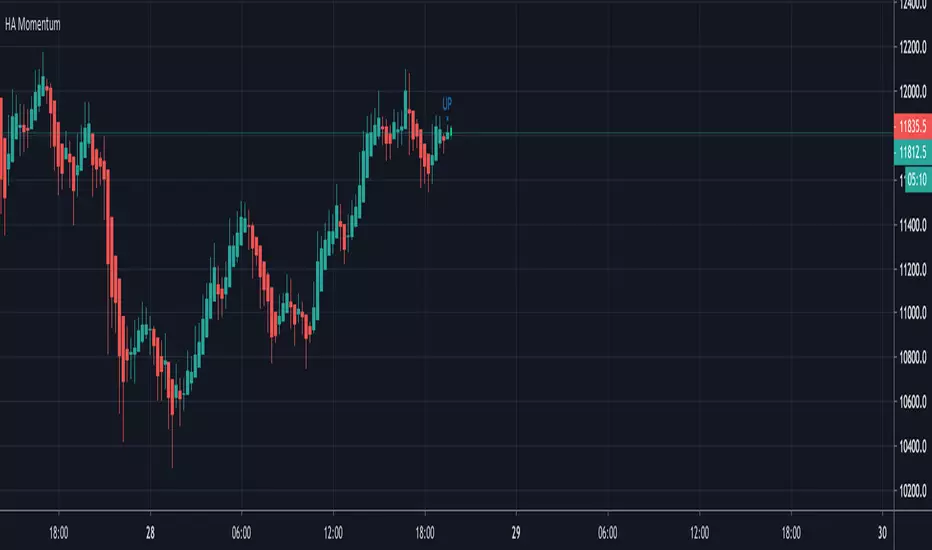
Next Candle HA MomentumVery simple script that updates realtime and shows possible next candle outcome and difference between current HA candle and current regular candle.
It's intended to use on Heikin Ashi and shows actual price on them, while on regular candles shows difference.
Idea was suggested by my husband and we decided to develop and publish it together.
Enjoy and check other scripts on my profile!
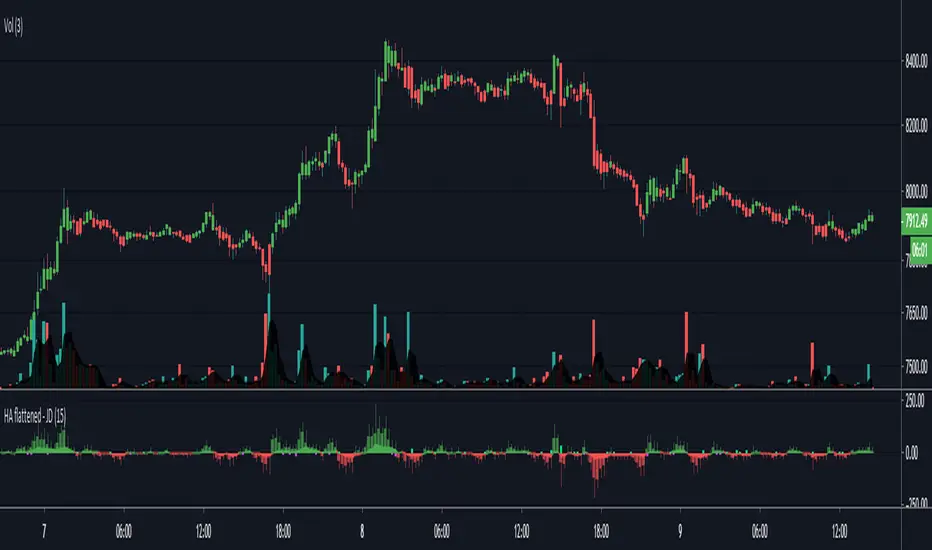
HA flattened - JDThis script gives you an opportunity to see the trend and price impulse information cointained in Heiken Ashi bars
whithout having to sacrifice seeing the raw price action of normal candles or other styles of charts.
I flattened out the HA bars to a straight line so it is easier to see if the candles momentum is picking up of fading
There is a Multi Time Frame option to show Heiken Ashi candles on another Time Frame.
There is the option to color the bars on the chart with the HA information (I use a 3 bar ma the further smooth out the info)
A last option is to add signals when the HA bars have wicks on the wrong side (down wicks on "up" candles an up wicks on "down" candles)
those can indicate price momentum staring to change into possible reversals or pull-backs soon.
JD.
#NotTradingAdvice
#DYOR
I build these indicators for myself and provide them open source, to use for free to use and improve upon,
as I believe the best way to learn is toghether.
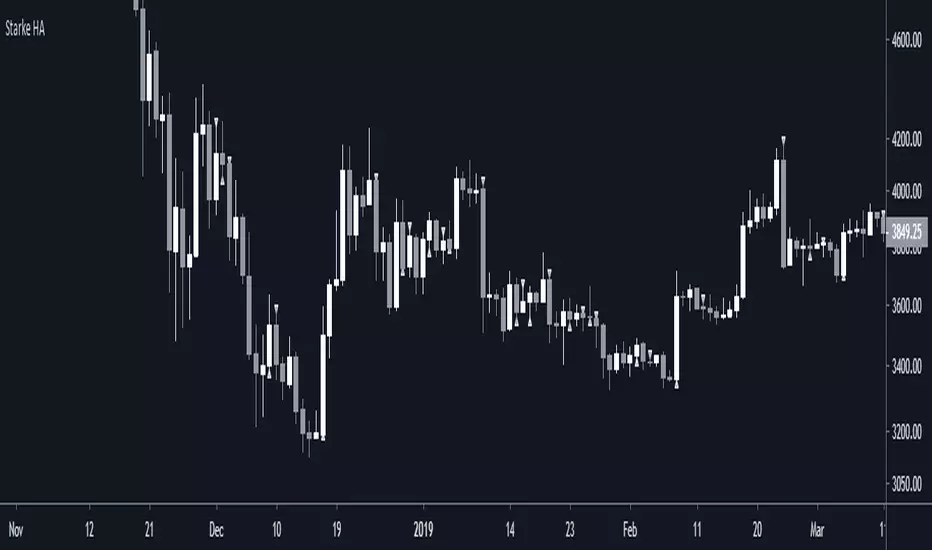
Starke Heikin AshiBasic script to show when Heikin Ashi changes up or down on-top of Japanese (regular) candles as opposed to using Heikin Ashi candles.

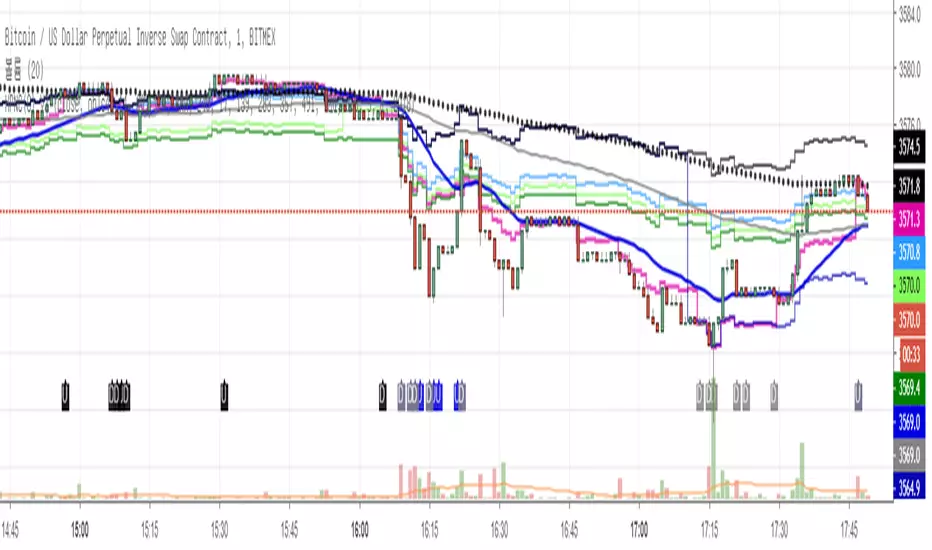
10/20 MA Cross-Over with Heikin-Ashi Signals by SchobbejakThe 10/20 MA Heikin-Ashi Strategy is the best I know. It's easy, it's elegant, it's effective.
It's particularly effective in markets that trend on the daily. You may lose some money when markets are choppy, but your loss will be more than compensated when you're aboard during the big moves at the beginning of a trend or after retraces. There's that, and you nearly eliminate the risk of losing your profit in the long run.
The results are good throughout most assets, and at their best when an asset is making new all-time highs.
It uses two simple moving averages: the 10 MA (blue), and the 20 MA (red), together with heikin-ashi candles. Now here's the great thing. This script does not change your regular candles into heikin-ashi ones, which would have been annoying; instead, it subtly prints either a blue dot or a red square around your normal candles, indicating a heikin-ashi change from red to green, or from green to red, respectively. This way, you get both regular and heikin ashi "candles" on your chart.
Here's how to use it.
Go LONG in case of ALL of the below:
1) A blue dot appeared under the last daily candle (meaning the heikin-ashi is now "green").
2) The blue MA-line is above the red MA-line.
3) Price has recently breached the blue MA-line upwards, and is now above.
COVER when one or more of the above is no longer the case. This is very important. You want to keep your profit.
Go SHORT in case of ALL of the below:
1) A red square appeared above the last daily candle (meaning the heikin-ashi is now "red").
2) The red MA-line is above the blue MA-line.
3) Price has recently breached the blue MA-line downwards, and is now below.
Again, COVER when one or more of the above is no longer the case. This is what gives you your edge.
It's that easy.
Now, why did I make the signal blue, and not green? Because blue looks much better with red than green does. It's my firm believe one does not become rich using ugly charts.
Good luck trading.
--You may tip me using bitcoin: bc1q9pc95v4kxh6rdxl737jg0j02dcxu23n5z78hq9 . Much appreciated!--

10/20 MA Cross-Over with Heikin-Ashi Signals by SchobbejakThe 10/20 MA Heikin-Ashi Strategy is the best I know. It's easy, it's elegant, it's effective.
It's particularly effective in markets that trend on the daily. You may lose some money when markets are choppy, but your loss will be more than compensated when you're aboard during the big moves at the beginning of a trend or after retraces. There's that, and you nearly eliminate the chances of losing your profit.
The results are good throughout most assets, and at their best when an asset is making new all-time highs.
It uses two simple moving averages: the 10 MA (blue), and the 20 MA (red), together with heikin-ashi candles. Now here's the great thing. This script does not change your regular candles into heikin-ashi ones, which would have been annoying; instead, it subtly prints either a blue dot or a red square around your normal candles, indicating a heikin-ashi change from red to green, or from green to red, respectively. This way, you get both regular and heikin ashi "candles" on your chart.
Here's how to use it.
Go LONG in case of ALL of the below:
1) A blue dot appeared under the last daily candle (meaning the heikin-ashi is now "green").
2) The blue MA-line is above the red MA-line.
3) Price has recently breached the blue MA-line upwards, and is now above.
COVER when one or more of the above is no longer the case. This is very important. You want to keep your profit.
Go SHORT in case of ALL of the below:
1) A red square appeared above the last daily candle (meaning the heikin-ashi is now "red").
2) The red MA-line is above the blue MA-line.
3) Price has recently breached the blue MA-line downwards, and is now below.
Again, COVER when one or more of the above is no longer the case. This is what gives you your edge.
It's that easy.
Now, why did I make the signal blue, and not green? Because blue looks much better with red than green does. It's my firm believe one does not become rich using ugly charts.
Good luck trading.
--You may tip me using bitcoin: bc1q9pc95v4kxh6rdxl737jg0j02dcxu23n5z78hq9 . Much appreciated!--

Function To Candles - Another way to see indicatorsIntroduction
There are different and better way's to see price data, a candlestick chart is one of the best way to see the price since you have access to the open/high/low/close information, this is really efficient and can allow for naked non parametric trading strategies (candlesticks patterns) . But what about making candles out of indicators ? There are tons of studies about candlesticks patterns in price data but none (?) about candlestick patterns using indicator data, therefore i made this script in order to show candles from various indicators, i also made an heikin-ashi mode.
Rsi To Candles
All the indicators are use the open/high/low/close price as input in order to return candles. length control the indicator period.
Stochastic To Candles
The stochastic oscillator is restrained in a range of 0/100, therefore when equal to 0 or 100 the candles can be flat.
Rate Of Change To Candles
The rate of change don't distort price as heavily as other indicators since its based on differencing.
Center Of Gravity To Candles
The center of gravity (cog) is defined from tradingview as "an indicator based on statistics and the Fibonacci golden ratio", its not an indicator i'am familiar with and i don't know if its the same proposed by Elhers. The candles are smooth, high length can flatten the candles heavily making them hard to see.
Correlation Oscillator
In a range of -1/1 this indicator is quite smooth and can also flatten candles.
Patterns And Heikin-Ashi
There are tons of patterns that can be generated from candlesticks, they can be applied to this indicator as well.
The indicator can show an heikin-ashi mode, heikin-ashi candlestick use averaging to plot candles, this is why they appear smoother, some signals generated from heikin-ashi candles are :
Bullish body with no lower shadows = Strong Uptrend
Bearish body with no higher shadows = Strong Downtrend
High range and small body = Indecision/Risk of reversal
Conclusion
I made an indicator able to draw candles from other indicators, those candles contain various information that can generate decision from patterns. I hope you find a use to it, if its the case share your findings with me, maybe that you will even be able find a new candlestick pattern :)
Thanks for reading !

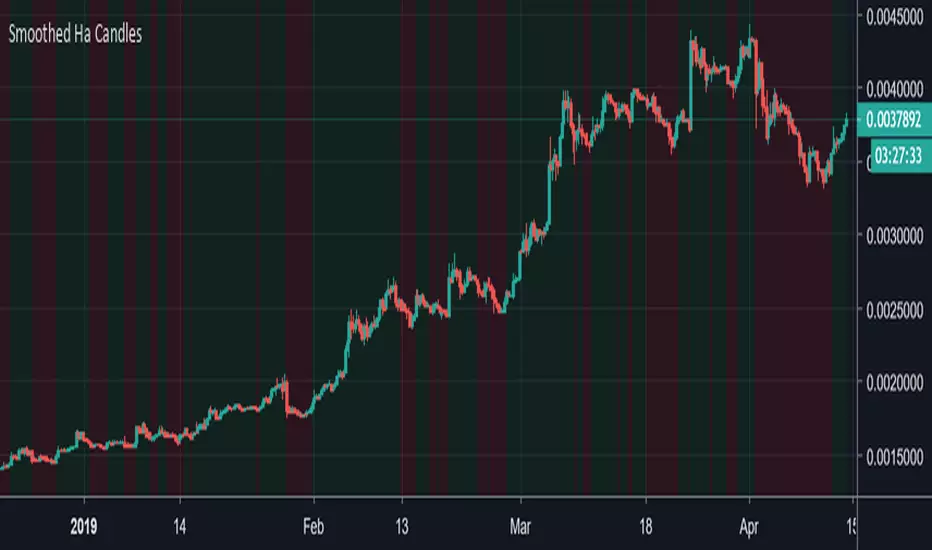
Smoothed Heiken Ashi CandlesScript that uses smoothed heikin ashi candles.
This is to be used on ordinary candles only.
I use this only on cryptocurrency. It's easy to dial in settings relative to each specific coin. I've found a lot of success using len1 particularly. Not to be used in small timeframes under 4 hours.
It will lose a lot of trades, but the point is that this strategy will catch any trends extremely well. This will more than offset any losses incurred along the way.
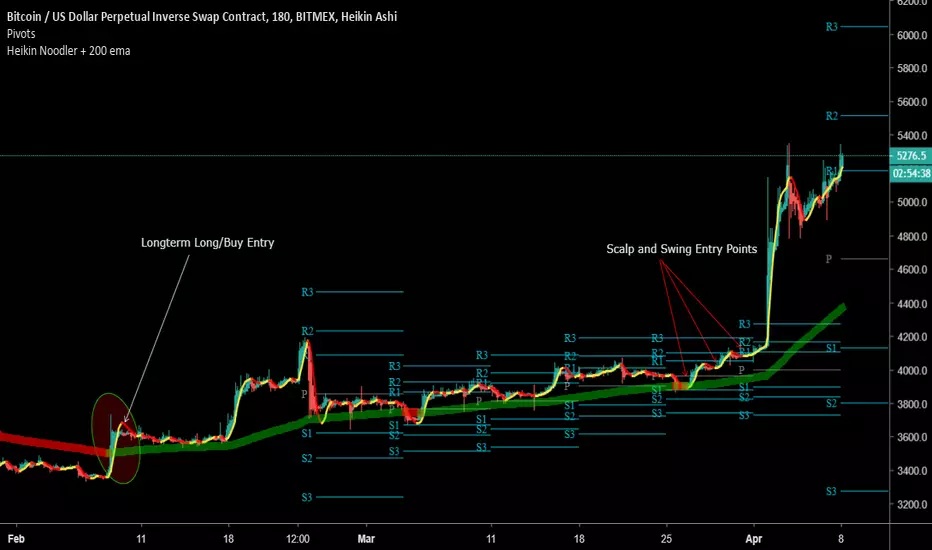
Heikin Noodler + 200 ema V2Respect the law of averages. When prices averages begin to move upward or downward, price generally follows the averaged direction.
Long/Buy on Green and Sell/Short on
Red.
I personally set my stop loss for longs/buys at the lowest low of the candles before the trend changes.
For shorts/sell, I set the stop loss at the highest high before the trend changed.
Alerts can be based on the color change.
Longer Term Trading Tip:
I added the 200 EMA, so we could identify longer term trends. The 200 EMA is th larger line turning green and red based on trend.
Wait until Heikin Noodler crosses the 200 to be at the potential start of trend change.
Scalping and Swing Trade Tips:
Trades are based solely on the smaller line which follows price directly. Just set your alerts, stop loss and ride it out.
Inbox me the words "I WANT IN NOW" for access to the indicator.
I will add people once per day. So no worries if you dont have access in 30 seconds...loI
I also have a small FREE chat group that I will be focusing on again as I have more time these days so we can share charts and ideas.
Happy Trading,
FIBAUS
Heikin Ashi OscillatorTrigger (Current Period): Heikin Ashi candle heights are plotted to form and oscillator.
Trend (1W): A slower period is also plotted.
When Trend is rising, dips in the Trigger are buying opportunities
When Trend is descending, peaks in the Trigger are selling opportunities

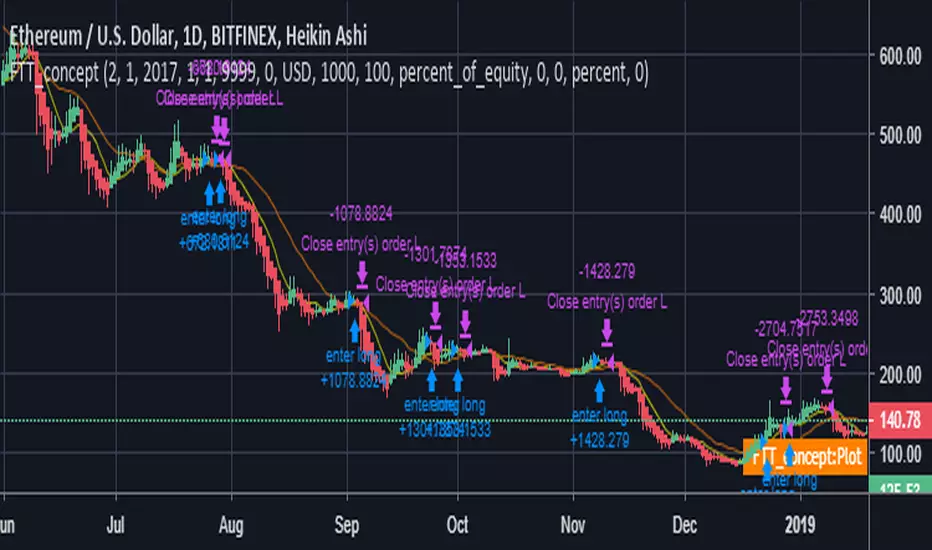
FTT_concept HTFTrend following Strategy utilizing Heikin Ashi candles. Best results at higher time frames (12H+). I personally prefer 1D TF.
Cheers
Tip box
BTC: 3FMew3LkwAf5x6K3qjT9Tp3pXNFCWKgEfT
ETH: 0xC72d4128f95E1759FdbF027F412E794b62fBBbE8
LTC: LQts3ypPKodNpmQGpPRMZhFaH3yhyDw7iL
IO_Heikin-Ashi OverlayThis is Traditional Heikin-Ashi bars overlayed with regular candlestick/any chart type
Although HA is available in TradingView by default, this script is to recalculate HA by traditional calculations.
This version REPAINTS!! This is because Traditional HA uses Close Price (which is calculated on the fly).
-- Invsto


Smoothed Heiken Ashi CandlesHeikin Ashi candle strategy. Catches trends. Works miracles over long periods of times on almost any asset.

Heikin Ashi CandlesBetter results on 23hr chart, input settings (len, len2) at 3.
To be used over long periods of time.