Kz GC1! ORBStrategy that trades breakouts on GC1! futures on the 5min timeframe. It also works on MGC1! for lower drawdown and to manage Apex and Top Step accounts with the lower risk.
Risk Disclaimer:
Past results as well as strategy tester reports do not indicate future performance. Guarantees do not exist in trading. By using this strategy you risk losing all your money.
Important:
It trades all days that markets are open. Set times may be seen on settings. Trades multiple times a day sometimes.
It works on the 5 and 15min timeframe only. Results are better on 5min timeframe.
The settings are optimized already for GC1! on the 5min timeframe.
How it works:
Every trading day it measures the range of the first 15min candle of pre-selected hours. As soon as price closes above or below on the 15min timeframe, it will trade the breakout targeting a set risk to reward ratio. SL on the opposite side of the range.
Settings:
Hourly Trading Hours: These are the times that worked best for this strategy. All boxes should be checked for best results. Excluded times were when it performed bad which is why those times have been left out.
ORB Formation Period: This setting determines on which timeframe candle has to close outside the opening range box in order to take a trade. It's set to 15min by default because this is what worked by far the best
Entry Type: Entries are immediate instead of waiting for a pull back to enter on a limit order.
Limit Orders: If enabled, the strategy will place a pending order x points from the current price, instead of a market order. Immediate orders are enabled by default for a better performance. Important: It doesn't actually place a limit order. The strategy will just wait for a pullback and then enter with a market order. It's more like a hidden limit order.
Limit Order Offset Points: If you have limit orders enabled, this setting determines how many points from the current price the limit order will be placed.
FVG Detection Type: How fast it detects the fair value gaps. Standard detection over immediate had better performance
Risk Type: You can chose either between Fixed USD Amount, Risk per Trade in % or Fixed Contract Size. By default it's set to fixed contract size.
Risk Amount (USD or Contracts): This setting is to set how many USD or how many contracts you want to risk per trade. Make sure to check which risk type you have selected before you choose the risk amount.
Take Profit Multiplier: This is simply the total SL size in points multiplied by x.
Example: If you put 2, you get a 2:1 Risk to Reward Ratio. By Default it's set to 2.5 because this gave the best results in backtests.
Stop Loss Padding: This is simply the buffer in points that is added to the SL for safety reasons. If you have it on 0, the SL will be at the exact price of the opposite side of the range. By default it's set to 5 because this is what delivered the best results in backtests.
Stop Loss Placement: This determines where the stop loss gets placed for the order. It has been set to ORB Range by default as this delivered the best results.
Max Trades Per Hour: This allows the user to decide how many trades are taken an hour. 1 is been set to default for best results
Visual Settings: Check boxes to show orb range, FVG's, Entry points, and trade visualization boxes.
Backtest Settings:
For the backtest the commissions were set to 1.29USD per contract and .35USD for micros which is the highest amount Tradovate charges Margin was not accounted for because typically on prop accounts you can use way more contracts than you need for the extremely low max drawdown. Margin would be important on personal accounts but even there typically it's not an issue at all especially because this strategy runs on the 15min timeframe so it won't use a lot of contracts anyways.
Why the source code is hidden:
The source code is hidden because I invested a lot of time and money into developing this strategy and optimizing it with paid 3rd party software.
Apex

PRO Investing - Apex EnginePRO Investing - Apex Engine
1. Core Concept: Why Does This Indicator Exist?
Traditional momentum oscillators like RSI or Stochastic use a fixed "lookback period" (e.g., 14). This creates a fundamental problem: a 14-period setting that works well in a fast, trending market will generate constant false signals in a slow, choppy market, and vice-versa. The market's character is dynamic, but most tools are static.
The Apex Engine was built to solve this problem. Its primary innovation is a self-optimizing core that continuously adapts to changing market conditions. Instead of relying on one fixed setting, it actively tests three different momentum profiles (Fast, Mid, and Slow) in real-time and selects the one that is most synchronized with the current price action.
This is not just a random combination of indicators; it's a deliberate synthesis designed to create a more robust momentum tool. It combines:
Volatility analysis (ATR) to generate adaptive lookback periods.
Momentum measurement (ROC) to gauge the speed of price changes.
Statistical analysis (Correlation) to validate which momentum measurement is most effective right now.
Classic trend filters (Moving Average, ADX) to ensure signals are only taken in favorable market conditions.
The result is an oscillator that aims to be more responsive in volatile trends and more stable in quiet periods, providing a more intelligent and adaptive signal.
2. How It Works: The Engine's Three-Stage Process
To be transparent, it's important to understand the step-by-step logic the indicator follows on every bar. It's a process of Adapt -> Validate -> Signal.
Stage 1: Adapt (Dynamic Length Calculation)
The engine first measures market volatility using the Average True Range (ATR) relative to its own long-term average. This creates a volatility_factor. In high-volatility environments, this factor causes the base calculation lengths to shorten. In low-volatility, they lengthen. This produces three potential Rate of Change (ROC) lengths: dynamic_fast_len, dynamic_mid_len, and dynamic_slow_len.
Stage 2: Validate (Self-Optimizing Mode Selection)
This is the core of the engine. It calculates the ROC for all three dynamic lengths. To determine which is best, it uses the ta.correlation() function to measure how well each ROC's movement has correlated with the actual bar-to-bar price changes over the "Optimization Lookback" period. The ROC length with the highest correlation score is chosen as the most effective profile for the current moment. This "active" mode is reflected in the oscillator's color and the dashboard.
Stage 3: Signal (Normalized Velocity Oscillator)
The winning ROC series is then normalized into a consistent oscillator (the Velocity line) that ranges from -100 (extreme oversold) to +100 (extreme overbought). This ensures signals are comparable across any asset or timeframe. Signals are only generated when this Velocity line crosses its signal line and the trend filters (explained below) give a green light.
3. How to Use the Indicator: A Practical Guide
Reading the Visuals:
Velocity Line (Blue/Yellow/Pink): The main oscillator line. Its color indicates which mode is active (Fast, Mid, or Slow).
Signal Line (White): A moving average of the Velocity line. Crossovers generate potential signals.
Buy/Sell Triangles (▲ / ▼): These are your primary entry signals. They are intentionally strict and only appear when momentum, trend, and price action align.
Background Color (Green/Red/Gray): This is your trend context.
Green: Bullish trend confirmed (e.g., price above a rising 200 EMA and ADX > 20). Only Buy signals (▲) can appear.
Red: Bearish trend confirmed. Only Sell signals (▼) can appear.
Gray: No clear trend. The market is likely choppy or consolidating. No signals will appear; it is best to stay out.
Trading Strategy Example:
Wait for a colored background. A green or red background indicates the market is in a tradable trend.
Look for a signal. For a green background, wait for a lime Buy triangle (▲) to appear.
Confirm the trade. Before entering, confirm the signal aligns with your own analysis (e.g., support/resistance levels, chart patterns).
Manage the trade. Set a stop-loss according to your risk management rules. An exit can be considered on a fixed target, a trailing stop, or when an opposing signal appears.
4. Settings and Customization
This script is open-source, and its settings are transparent. You are encouraged to understand them.
Synaptic Engine Group:
Volatility Period: The master control for the adaptive engine. Higher values are slower and more stable.
Optimization Lookback: How many bars to use for the correlation check.
Switch Sensitivity: A buffer to prevent frantic switching between modes.
Advanced Configuration & Filters Group:
Price Source: The data source for momentum calculation (default close).
Trend Filter MA Type & Length: Define your long-term trend.
Filter by MA Slope: A key feature. If ON, allows for "buy the dip" entries below a rising MA. If OFF, it's stricter, requiring price to be above the MA.
ADX Length & Threshold: Filters out non-trending, choppy markets. Signals will not fire if the ADX is below this threshold.
5. Important Disclaimer
This indicator is a decision-support tool for discretionary traders, not an automated trading system or financial advice. Past performance is not indicative of future results. All trading involves substantial risk. You should always use proper risk management, including setting stop-losses, and never risk more than you are prepared to lose. The signals generated by this script should be used as one component of a broader trading plan.

Lot Size Calculator (SL Percentage) - Futures ⚠️ IMPORTANT DISCLAIMER
This indicator is provided for educational and informational purposes only. The author assumes no responsibility for any financial losses, code errors, calculation mistakes, or trading decisions based on this tool. Use at your own risk and responsibility. Always manually verify calculations before opening real positions.
Contract size calculations are based on standard full-size futures contracts, not micro contracts (even though micro contracts are supported for identification).
Description
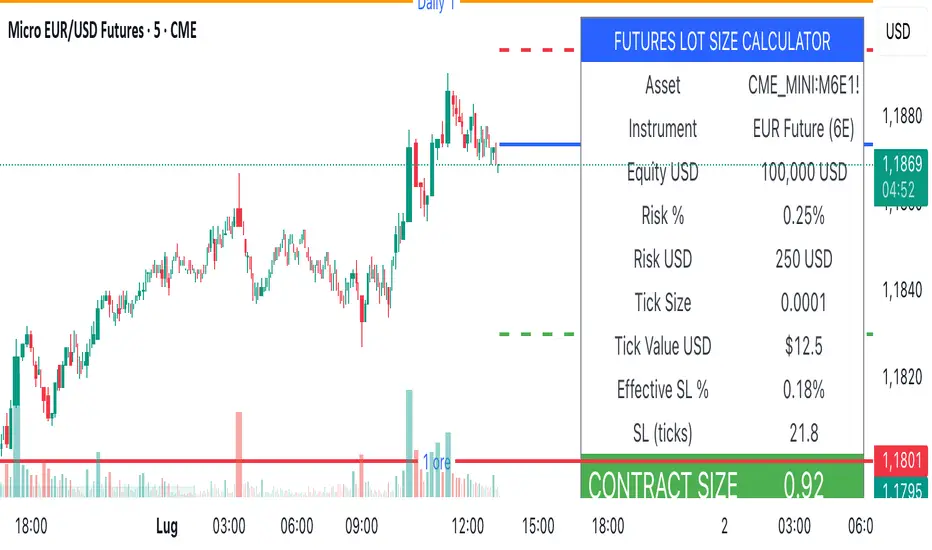
Money management tool for automatic calculation of optimal contract size (lot size) in futures trading. Supports over 50 futures instruments with pre-configured tick sizes and pip values for CME and other exchanges.
Supported Instruments
Currency Futures: 6J, 6E, 6B, 6A, 6C, 6S, 6N
Index Futures: ES, NQ, YM, RTY, MES, MNQ, MYM, M2K, NKD
Energy: CL, NG, HO, RB, QM
Metals: GC, SI, HG, MGC, SIL
Agricultural: ZC, ZS, ZW, HE, LE, ZO, ZR, ZM, ZL
Interest Rates: ZN, ZB, ZT, ZF
Crypto: MBT, MET
Others: VX
Main Parameters
Equity : Total available capital
Risk : Maximum risk percentage per trade
Stop Loss : Percentage distance of stop loss
Risk/Reward Ratio: Ratio to calculate take profit
Entry Price: Entry price (0 = current price)
Stop Loss Modes
Percentage Stop Loss (Use SL in % = ON):
Automatically calculates SL level as percentage from entry price
Example: Entry 100, SL 2% → Long SL at 98, Short SL at 102
Manual Stop Loss (Use SL in % = OFF):
Enter exact stop loss price directly
Greater precision for specific technical levels (support/resistance)
Interactive feature: You can drag the red stop loss line directly on the chart to modify the level in real-time
How to Use
Set equity and risk % according to your trading plan
Choose direction (Long/Short) and stop loss (percentage or price)
Enter entry price (optional)
Read the CONTRACT SIZE in the green table
Verify levels Entry/SL/TP on the graphic lines
Output
Information table with all parameters and highlighted CONTRACT SIZE
Graphic lines: Entry (blue), Stop Loss (red), Take Profit (green)
Configurable alerts with calculated values
Advantages
✅ Automatic calculation of optimal size
✅ Precise tick sizes for each instrument
✅ Systematic risk management
✅ Clear visual interface
✅ Multi-asset support on futures
Warnings
⚠️ Always verify that the instrument is recognized (no orange warning)
⚠️ Manually check calculations before trading
⚠️ Test in demo before using with real money
⚠️ Update regularly for any contract modifications
⚠️ DISCLAIMER IMPORTANTE
Questo indicatore è fornito esclusivamente a scopo educativo e informativo. L'autore non si assume alcuna responsabilità per eventuali perdite finanziarie, errori nel codice, calcoli errati o decisioni di trading basate su questo strumento. L'utilizzo è a proprio rischio e responsabilità. Si raccomanda di verificare sempre manualmente i calcoli prima di aprire posizioni reali.
I calcoli della dimensione del contratto sono basati su contratti futures standard full-size, non micro contratti (anche se i micro contratti sono supportati per l'identificazione).
Descrizione
Strumento di money management per il calcolo automatico della dimensione ottimale del contratto (lot size) nel trading di futures. Supporta oltre 50 strumenti futures con tick size e pip value pre-configurati per mercati CME e altri exchange.
Strumenti Supportati
Currency Futures: 6J, 6E, 6B, 6A, 6C, 6S, 6N
Index Futures: ES, NQ, YM, RTY, MES, MNQ, MYM, M2K, NKD
Energy: CL, NG, HO, RB, QM
Metals: GC, SI, HG, MGC, SIL
Agricultural: ZC, ZS, ZW, HE, LE, ZO, ZR, ZM, ZL
Interest Rates: ZN, ZB, ZT, ZF
Crypto: MBT, MET
Altri: VX
Parametri Principali
Equity : Capitale totale disponibile
Risk : Percentuale massima di rischio per trade
Stop Loss : Distanza percentuale dello stop loss
Risk/Reward Ratio: Rapporto per calcolare il take profit
Entry Price: Prezzo di entrata (0 = prezzo corrente)
Modalità Stop Loss
Stop Loss Percentuale (Use SL in % = ON):
Calcola automaticamente il livello SL come percentuale dal prezzo di entrata
Esempio: Entry 100, SL 2% → SL Long a 98, SL Short a 102
Stop Loss Manuale (Use SL in % = OFF):
Inserisci direttamente il prezzo esatto dello stop loss
Maggiore precisione per livelli tecnici specifici (supporti/resistenze)
Funzione interattiva: Puoi trascinare direttamente la linea rossa dello stop loss sul grafico per modificare il livello in tempo reale
Come Usare
Imposta equity e risk % secondo il tuo piano di trading
Scegli direzione (Long/Short) e stop loss (percentuale o prezzo)
Inserisci entry price (opzionale)
Leggi il CONTRACT SIZE nella tabella verde
Verifica i livelli Entry/SL/TP sulle linee grafiche
Output
Tabella informativa con tutti i parametri e il CONTRACT SIZE evidenziato
Linee grafiche: Entry (blu), Stop Loss (rosso), Take Profit (verde)
Alert configurabile con i valori calcolati
Vantaggi
✅ Calcolo automatico della size ottimale
✅ Tick size precisi per ogni strumento
✅ Risk management sistematico
✅ Interfaccia visiva chiara
✅ Supporto multi-asset su futures
Avvertenze
⚠️ Verifica sempre che lo strumento sia riconosciuto (no warning arancione)
⚠️ Controlla manualmente i calcoli prima di tradare
⚠️ Testa in demo prima dell'uso con denaro reale
⚠️ Aggiorna regolarmente per eventuali modifiche ai contratti
[GrandAlgo] Impulse & Balance
The Impulse & Balance indicator identifies and labels three key levels—Impulse, Balance, and Apex—offering traders a structured and dynamic view of market behavior. Starting with the detection of Impulse levels, the indicator calculates corresponding Balance zones and Apex levels to provide actionable insights into price movement, potential reversals, and trend stability.
This indicator adapts seamlessly to all timeframes and market types, giving traders a powerful tool for understanding market dynamics and refining their strategies.
How It Works:
Impulse: Identifies critical price levels where significant market conditions occur. These Impulse levels serve as the foundation for calculating Balance and Apex levels.
Balance: Derived from Impulse levels, Balance zones mark areas of equilibrium where price tends to stabilize. These zones often act as key support or resistance areas.
Apex: The Apex is calculated as a pivotal level where price momentum within the Impulse reaches a peak, highlighting potential reversal or reaction points.
The indicator dynamically updates these levels in real-time as price evolves, ensuring that traders always have the most relevant data on their charts.
Key Features:
Automatically detects Impulse, Balance, and Apex levels for structured market analysis.
Continuously recalculates levels in real-time as price action evolves.
Offers customizable parameters for sensitivity and detection range.
Works seamlessly across all timeframes and market types.
Provides clear visual labels for effortless interpretation.
Use Cases:
Spot potential reversal zones or price reaction points using Apex levels.
Identify key price stabilizations with Balance zones for support and resistance analysis.
Monitor Impulse levels for insights into significant market conditions and momentum.
Suitable for various instruments, including Forex, crypto, stocks, and indices.

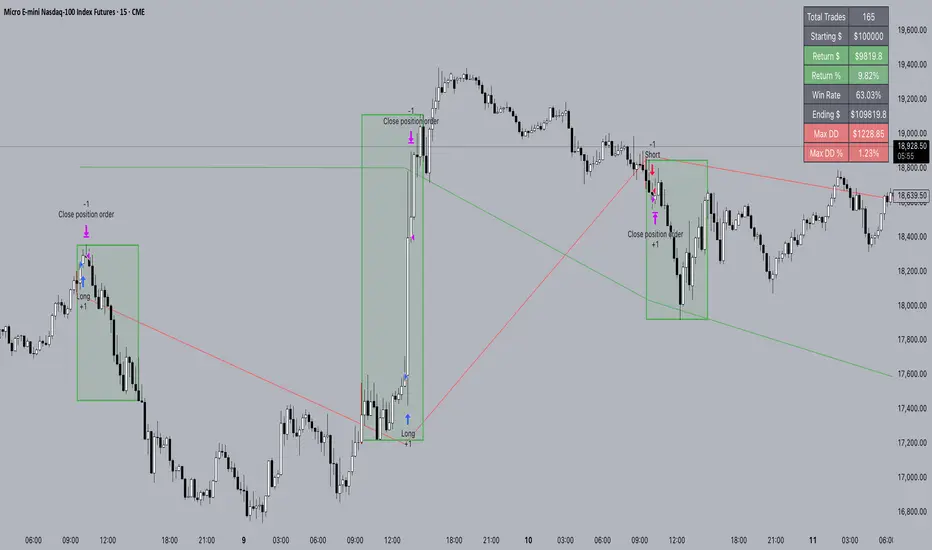
FXC NQ Opening Range Breakout Strategy V2.4Mechanical Strategy that trades breakouts on NQ futures on the 15min timeframe during the NYSE session. It's designed to manage Apex and Top Step accounts with the lowest risk possible.
Risk Disclaimer:
Past results as well as strategy tester reports do not indicate future performance. Guarantees do not exist in trading. By using this strategy you risk losing all your money.
Important:
It only trades on Monday, Wednesday and Friday and takes usually only 1 trade per trading day.
It works on the 15min timeframe only.
The settings are optimised already for NQ but feel free to change them.
How it works:
Every selected trading day it measures the range of the first 15min candle after the NYSE open. As soon as price closes above on the 15min timeframe, it will trade the breakout targeting a set risk to reward ratio. SL on the opposite side of the range. It will trail the SL after a set amount of points and uses a buffer of the set amount of points to trail it.
Settings:
Opening Range Time : This is the time of the day in hours and minutes when the strategy starts looking for trades. It's in the EST/ NY Timezone and set to 9:30-09:45 by default
because that's the NYSE open.
Session Time : This is the time of the day in hours and minutes until the strategy trades. It's in the EST/ NY Timezone and set to 09:45-14:45 by default.
because that's what gave the best results in backtesting. Open trades will get closed automatically once the end of the session is reached. No matter if win or loss. This is just to prevent holding positions over night.
Session Border This setting is to select the border color in which the session box will be plotted.
Opening Range Box This setting is to select the fill color of the opening range box.
Opening Range Border This setting is to select the border color of the session box.
Trade Timeframe This setting determines on which timeframe candle has to close outside the opening range box in order to take a trade. It's set to 15min by default because this is what worked by far the best in backtests and live trading.
Stop Loss Buffer in Points: This is simply the buffer in points that is added to the SL for safety reasons. If you have it on 0, the SL will be at the exact price of the opposite side of the range. By default it's set to 0 pips because this is what delivered the best results in backtests.
Profit Target Factor: This is simply the total SL size in points multiplied by x.
Example: If you put 2, you get a 1:2 Risk to Reward Ratio. By Default it's set to 4 because this gave the best results in backtests, because trades always get closed either by trailing SL or because the end of the session is reached.
Use Trailing Stop Loss: This setting is to enable/ disable the trailing stop loss. It's enabled by default because this is a fundamental part of the strategy.
Trailing Stop Buffer: This setting determines after how many points in profit the trailing SL will be activated.
Risk Type: You can chose either between Fixed USD Amount, Risk per Trade in % or Fixed Contract Size. By default it's set to fixed contract size.
Risk Amount (USD or Contracts): This setting is to set how many USD or how many contracts you want to risk per trade. Make sure to check which risk type you have selected before you chose the risk amount.
Use Limit Orders If enabled, the strategy will place a pending order x points from the current price, instead of a market order. Limit orders are enabled by default for a better performance. Important: It doesn't actually place a limit order. The strategy will just wait for a pullback and then enter with a market order. It's more like a hidden limit order.
Limit Order Distance (points): If you have limit orders enabled, this setting determines how many points from the current price the limit order will be placed.
Trading Days: These checkboxes are to select on which week days the strategy has to trade. Thursday is disabled by default because backtests have shown that Thursday is the least profitable day
Backtest Settings:
For the backtest the commissions ere set to 0.35 USD per mini contract which is the highest amount Tradeovate charges. Margin was not accounted for because typically on Apex accounts you can use way more contracts than you need for the extremely low max drawdown. Margin would be important on personal accounts but even there typically it's not an issue at all especially because this strategy runs on the 15min timeframe so it won't use a lot of contracts anyways.
What makes it unique:
This script is unique because it's designed to be used on Apex and Top Step accounts with extremely strict drawdown rules.
The strategy is optimised to be traded with a fixed contract size instead of using % risk. The reason for that is that the drawdown rules of these Futures Prop Accounts are very strict and the fact that the smallest trade-able contract size is 1.
Why the source code is hidden:
The source code is hidden because I invested a lot of time and money into developing this strategy and optimising it with paid 3rd party software. Also since I use it myself on my Apex accounts and prop firms don't allow copy trading I don't want it to be used by too many traders.
ApexBull Algorithmic IndicatorOfficial ApexBull ALL IN ONE Algorithm - Swing and Short Term Indicator!
Description:
A new indicator that provides algorithmic entries for longer term swing trading to intraday traders and scalpers. You choose what time frame to trade!
Built-in features allow to separate signals for both longer and shorter term time frames with algorithm using different settings for each to take advantage of short term moves in more aggressive markets, as well as, give you more conservative, more reliable swing trades for longer term investment horizons. Works on anything from monthly to 1 minute charts. We found that most traders should start with 4 and 1 hour time frames with more conservative settings enabled and then venture out into more aggressive territory.
Algorithm is set to target trending movements and ensure you stay out from whipsaw conditions.
The indicator also features a built-in STOP LOSS levels so you dont have to wonder anymore how close or far to set your stop loss and not to be whipsawed out of your winning trades.
If you would like to try out our indicator please send me a direct message here.

APEX - Parabolic SARSorry to all my fans I have been overwhelmed with work and I need a couple of weeks off ... but now I have vacation time and I should be fit in a bit.
This is a for meant for the Apex Trader I very much enjoy and is long overdue.
Looks like the normal implementation of PSAR in TA-Lib is using no start compared to the Standard that TV delivers thus to make the user more comfortable this tiny change :)
Wish you all good luck and a lot of love!

Apex - Chandelier Exit (CE)Is a volatility based indicator that helps to identify LONG and SHORT positions. Was developed by Chuck Le Beau but was introduce by Alexander Elder in the publication “Come into My Trading Room,” which was published in 2002.
Can be used as an entry or exit/trailing. Or a simple yet very effective trend which is the main reason it was added into the Apex. When you ask what is the difference to ATR Stop. This indicator has similar logic but is much more finetuned to not give as many fake signals as its predecessor.
This indicator does not differ to any other CE just is finetuned to match the output of Apetrades as much as possible. When using different timeframe than on the chart, then the number will not match perfectly due to tradingview solution of a security function.
Enjoy.

Aurora Borealis SuperGuppy AccumulatorAccumulator Script for BTC using Apex Trading Bot. Also using it to signal longs and shorts for myself from time to time.
It's heavily based on Super Guppy with some added modifications to simplify my trading. It requires a dip in the superguppy and then looks at the 2 previous candles to confirm that we are now heading the right way.
It will not be 100% accurate but it will aid me in my trading.

APEX - Swing Aura StrategyA backtester of my new strat, it's a hybrid swing/scalp strat that really looks for quick low profits. Will keep it hidden as it's a bit of a work in progress right now. Working on it to perform well enough with the Apex Trading bot, ran it for a day now and it ended the day on a 1.78% portfolio profit, so I'm really pleased with that.
As for details it's based on Keltner Channels, Bolingers Bands and a Ichimoku cloud. To spice it up there's even a Wave trend in there as well!
All the settings for the bits and parts are changeable so feel free to mess around with them, but will keep my sell triggers fixed for now, so no editing of those from within the script unfortunately.
Enjoy!

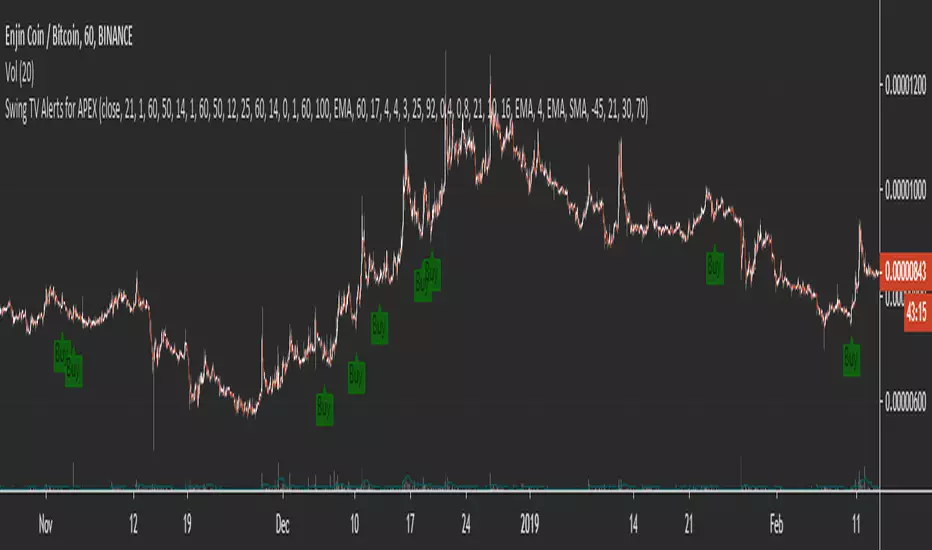
Swing TV Alerts for APEXI have put a collection of my favorite scripts together so that everyone can make a simple entry trading system with it.
You first have to think about using a trend filter there are several of them you can pick I would advise using at least one. After that, you select a combo of the most popular indicators on Tradingview for an exact entry. SO far my personal favorite is Godmode / Wavetrend.
Then you add alerts and either trade manually or use one of the services that allow you to put buy orders vie alerts such as Autoview / Profitview /Profit trailer or my personal favorite APEX.
I have hidden the code cause it's messy but you don't need to worry there is zero repainting.
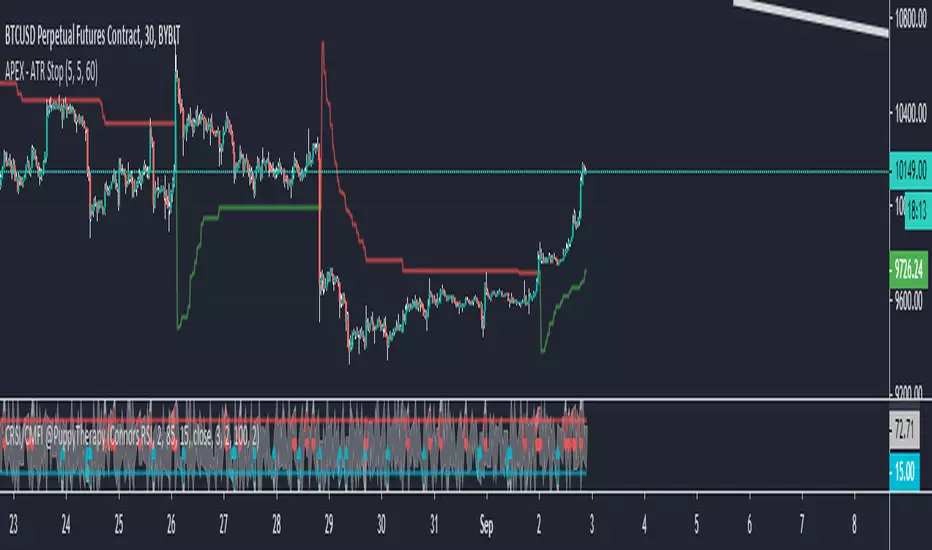
APEX - ATR StopThe ATR Stops are mainly used as an advanced trailing technique, but they can also be used as a trend filter.
When you add the ATR Stop in APEX you will get access to 2 signals. The Stop loss shows the value where the trailing is occurring. The sentiment on the other side shows you what bias does this indicator give 1 = long and -1 = short. To play with different values please use the following indicator on TV. Will help you to finetuned the length of ATR and the multiplier value.
APEX - Moving Averages [v1]A moving average is the most known indicator that takes into consideration price from the last several periods of the price and calculates a smoothed line also known as a Moving average. This way you will cut out a lot of the noise and have a different view.
The most common usage is the moving average crossover system when you buy and sell when a crossover happens. This system is in general not very profitable but can be used effectively in trending markets.
There is really no general rule to what length should be used. The most well-known and respected lengths are 20 / 50 / 100 / 200 for almost all average. These values are respected as strong resistance and support levels. but if you plan to use a crossover Systems the most profitable settings tend to be when the averages are close together 14 and 28 etc. But this is an area I would appeal to for you to really try out what works and what does not.
Other uses of moving averages are the following:
Crossover system
Moving averages are pointing up and price crosses below (Buy Pullback)
The slow-moving average is Below the fast moving average to help to identify possible bullishness
Can be used as support and resistance lines
If you are an advanced user you may want to try out the following techniques:
Create your own moving average by combining several of those together with the source function
Using the Average True Range to create Keltner Channels
Using Standard deviation to create Bollinger bands (Bollinger bands are also accessible on their own)
You can use Moving averages to smooth the noise on other indicators such as RSI / CCI / MFI
APEX - ADX/ADXR/DI+/DI- [v1]Average Directional Movement Index – ADX can be used to help measure the overall strength of a trend. The ADX indicator is an average of expanding price range values. The ADX is a component of the Directional Movement System developed by Welles Wilder. This indicator on its own does not give you a direction but instead measure the strength of the trend. In general values above 20 are considered a trending environment above 30 is then a strong trend and above 50 is a very strong trend.
Average Directional Movement Rating is based on the momentum change of the ADX itself. It is calculated by adding two ADX values (the current value and a value n periods back), then dividing by two. This additional smoothing makes than the ADXR slightly less responsive than ADX but helps to avoid noise.
Minus Directional Indicator (-DI) measures the presence of a downtrend and is part of the Average Directional Index (ADX). If -DI is sloping upward, it's a sign that the price downtrend is getting stronger. The Positive Directional Indicator (+DI) is a component of the Average Directional Index (ADX) and is used to measure the presence of an uptrend. When the +DI is sloping upward, it is a signal that the uptrend is getting stronger. In general values above 20 are considered a trending environment above 30 is then a strong trend and above 50 is a very strong trend.
APEX - ROC MA [v1]The rate of change also know as ROC is a momentum indicator that describes changes over a specific period of time. In general positive values describe for the asset to have a positive momentum change whereas negative values will give a negative momentum change.
You will be able to add moving averages or additionally smooth the ROC to create a more stable indicator for filtering or entries.
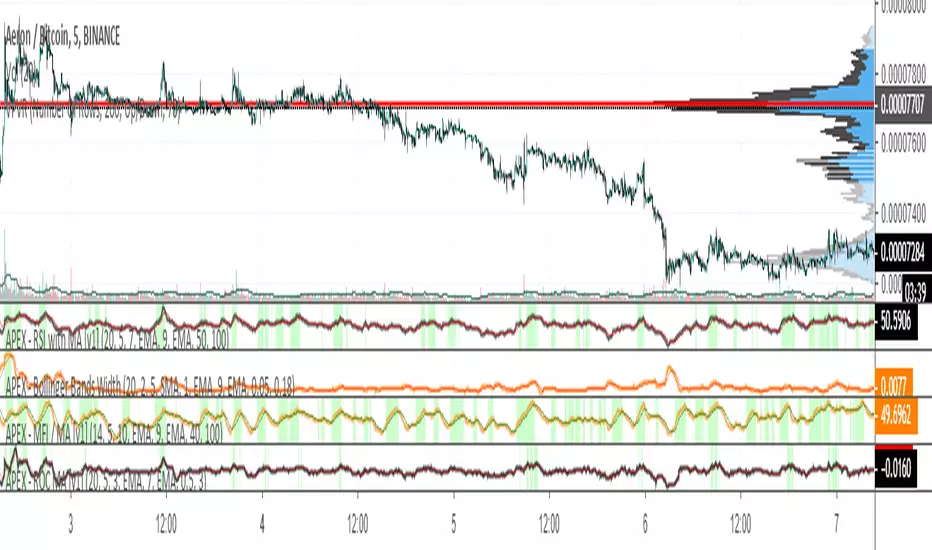
APEX - MFI / MA [v1]The Money Flow Index is a volume indicator used for measuring buying and selling pressure. This is done by analyzing both price and volume. The MFI's calculation generates a value that is then plotted as a line that moves within a range of 0-100, making it an oscillator. When the MFI rises, this indicates an increase in buying pressure. When it falls, this indicates an increase in selling pressure. The Money Flow Index can generate several signals, most notably; overbought and oversold conditions and divergences.
You are also able to add addition smoothing and or a moving average on top of the MFI. This can help you trade only areas with increasing buying pressure.
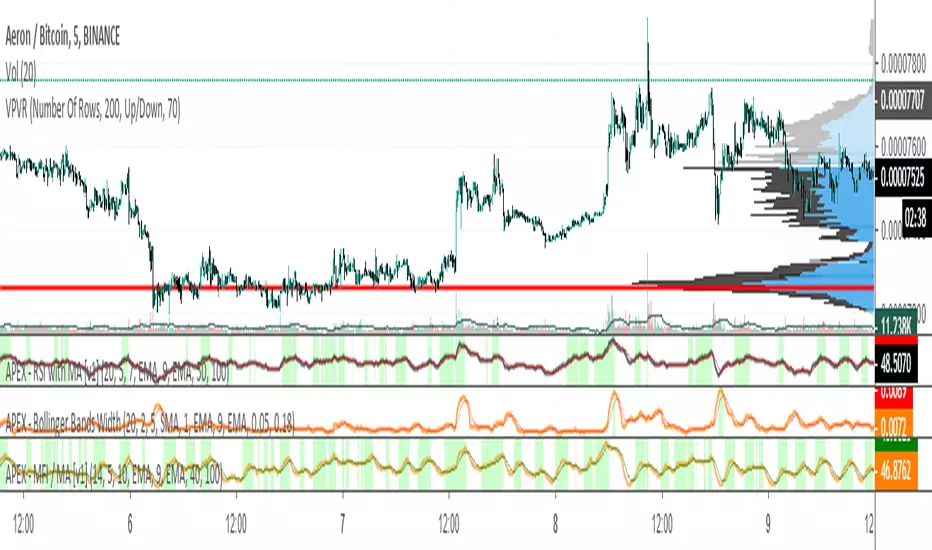
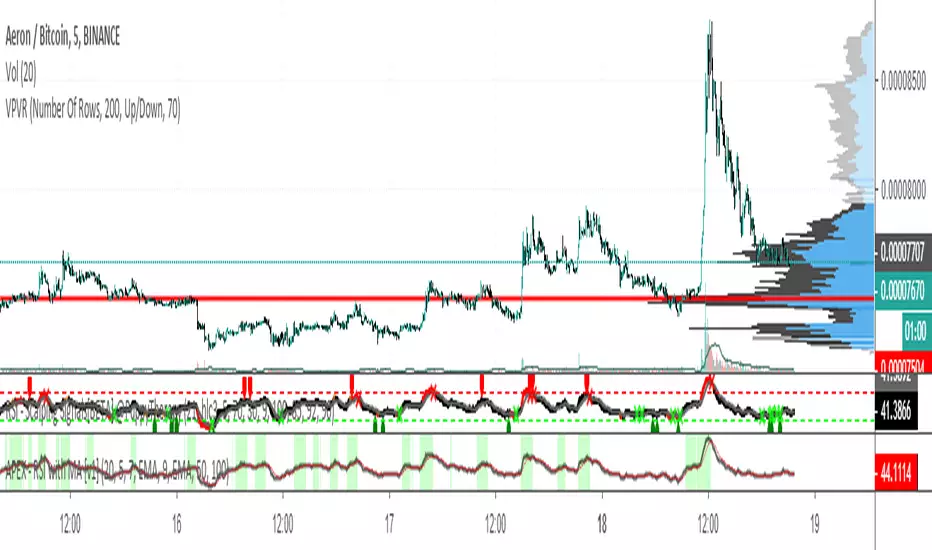
APEX - RSI with MA [v1]The Relative Strength Index (RSI) is as a momentum oscillator originally developed by J. Welles Wilder. The indicator is calculated as a Ratio of higher closes to lower closes on a scale of 0 to 100.
If the indicator reaches values above 80 (some use 70 or 75) it means the instrument is overbought and if the values are below 20 (25 or 30) it is oversold. But be aware those are just terms oversold/overbought main oversold /overbought for a long time. In general values over 50 mean your instrument is in a bullish state and below 50 it is in a bearish state.
The indicator is most commonly used with the length of 14. Some use RSI in a much more aggressive manner with the length of 2 (also known as Connors RSI). Whereas others have used length up to 20.
Use greater length values on the lower the timeframe to help with the noise. On larger time frames, you should be looking at lower length values.
APEX - Aroon / Aroon Oscillator [v1]Simple Script that combines Aroon and Aroon Oscillator with MTF functionality for APEX.
Aroon
The Aroon also know as Aroon Up/Down will help you determine the trend of the asset of if the asset is ranging. The indicator consists of two lines the AroonDown and the Aroon Up.When Aroon Up reaches 100, a new uptrend may have begun. If it remains persistently between 70 and 100, and the Aroon-Down remains between 0 and 30, then a new uptrend is underway.If the Aroon-Up crosses above the Aroon-Down, then a new uptrend may start soon. Conversely, if Aroon-Down crosses above the Aroon-Up, then a new downtrend may start soon. When Aroon-Up reaches 100, a new uptrend may have begun. If it remains persistently between 70 and 100, and the Aroon-Down remains between 0 and 30, then a new uptrend is underway.
Aroon Oscillator
The Aroon Oscillator is the difference between Aroon-Up and Aroon-Down. These two indicators are usually plotted together for easy comparison, but chartists can also view the difference between these two indicators with the Aroon Oscillator. This indicator fluctuates between -100 and +100 with zero as the middle line. An upward trend bias is present when the oscillator is positive, while a downward trend bias exists when the oscillator is negative.

APEX - Absolute Price Oscillator [v1]The Absolute Price Oscillator is calculated as a difference of two moving averages of an asset and is expressed as an absolute value. It rates the strength of the trend. This Oscillator can be used primarily as a filter for stronger trends or for coin specific strategies.
Values are a coin and Moving average base specific.
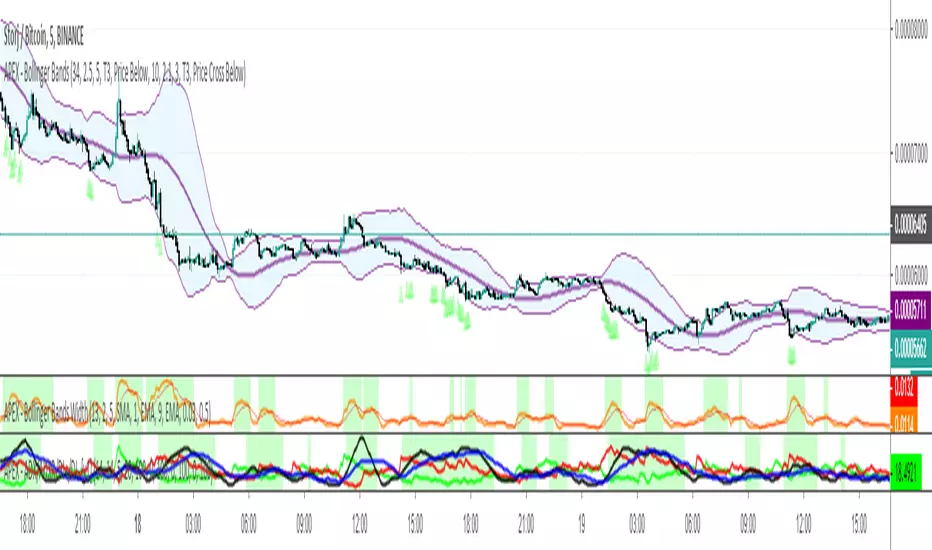
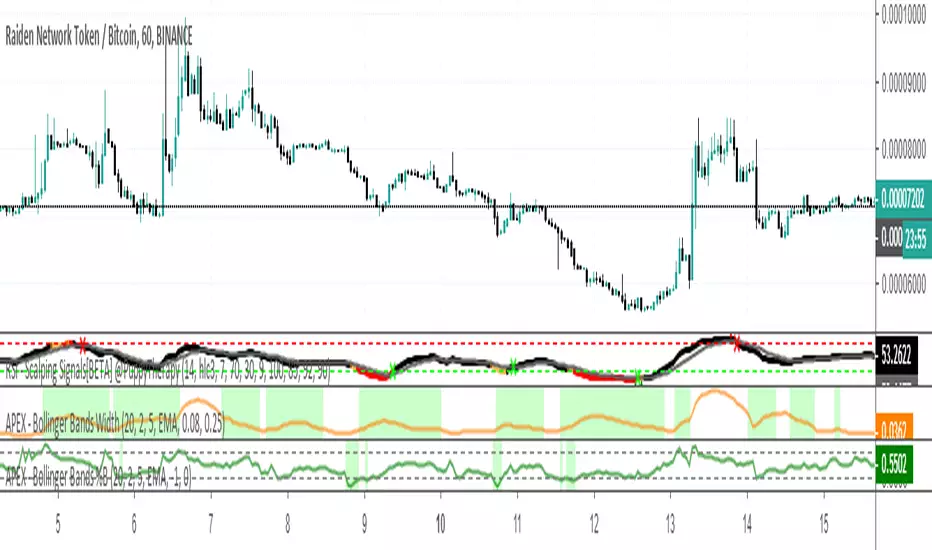
APEX - Bollinger Bands WidthBollinger Bands Width (BBW) is an indicator derived from the Bollinger Bands indicator. BBW are measuring the volatility of an asset. The plotted curve will help you identify high and low volatility areas. Some strategies work only if there is some level of Volatility whereas others not enjoy it. When creating your strategy have a look at numbers between 0.02 – 0.10 (2 to 10 percent on 5m timeframe ) is the most common value. You can also easily avoid big pumps/dumps by using BBW in your strategy.

APEX - Bollinger Bands %BBollinger Bands %B is essentially BB Range it is an indicator derived from the standard Bollinger Bands. Bollinger Bands are a volatility indicator that creates a band of three lines which are plotted on the screen.
Bollinger Bands %B works the same as other momentum oscillators, it is best to look for short-term oversold in this case a volatility imbalance between upper and lower volatility. You are looking for values that are near 0 or negative.
Compared to other momentum Oscillators the %B is slightly less responsive than CCI but it does provide more signals than RSI / STOCH and STOCHRSI.
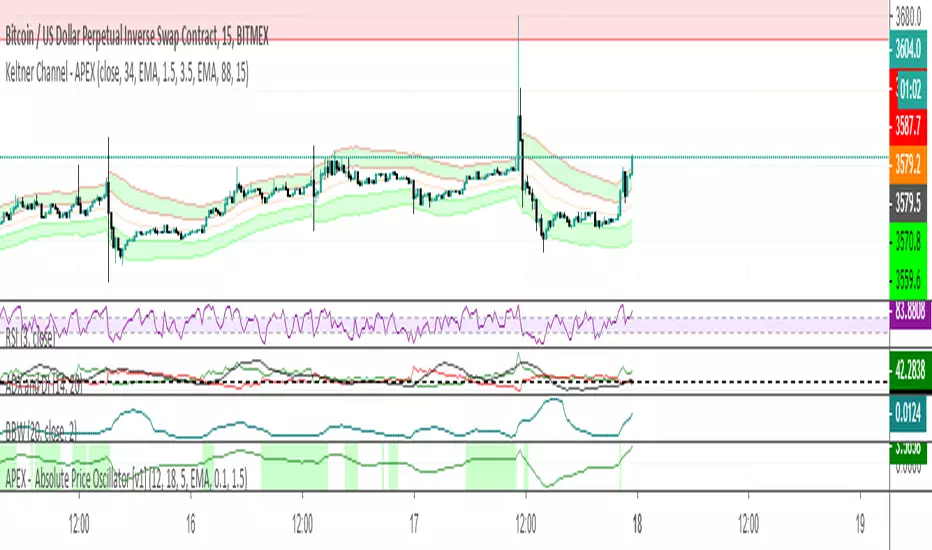
Keltner Channel - APEXKeltner Channels are volatility-based bands built above and below an exponential moving average. This indicator is similar to Bollinger Bands but instead of Standart deviation of using the standard deviation uses the Average True Range (ATR) to set channel distance. The Keltner Channels it present for only allow EMA addition and EMA smoothing. Therefore I have taken the liberty to add those as default.
You can use the channels in its form to help you get into more volatile moves and thus getting out faster. I wanted to show an approach of screening area below a moving average by adding min max ATR. In Apex you will have to use 2 Keltner Channels with 2 Signals to build this up.
This feature will be available first in v1 APEX.

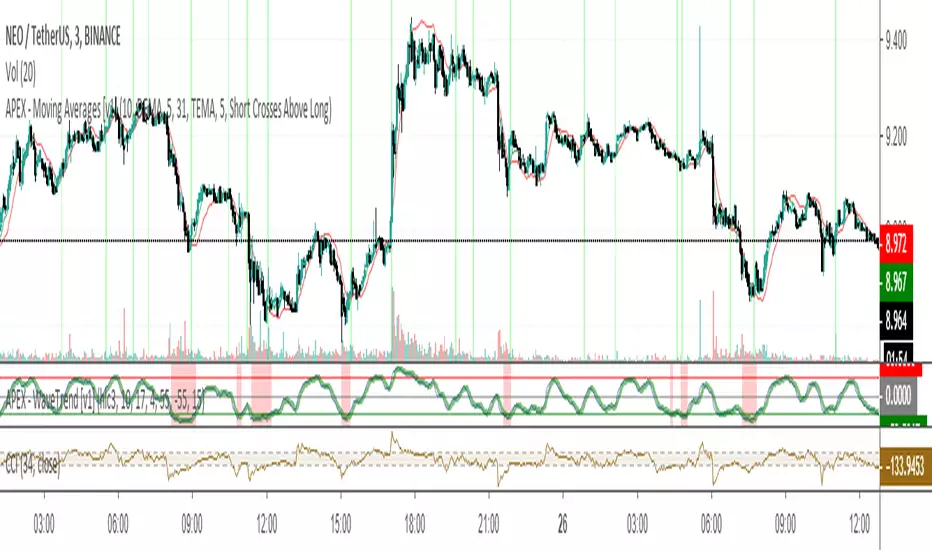
APEX - WaveTrend [v1]WaveTrend is a smoothed oscillator which enables it to detect true reversals in an extremely accurate manner. The beauty of this indicator is that does not generate signals during choppy sideways markets.
The basic settings are 10 / 3 / 4 these are very aggressive settings, that will generate a lot of signals in all even not so volatile markets. If you need high-quality signals you settings close to 10 / 3 /21. The strongest buy/sell signals are given when the cross occurs above or below the threshold. In the 10 / 3 / 4 you threshold for buy should be around -90 values. If you use the very smoothed variant the threshold will be around -45 to -50 values.
This indicator will be first available in APEX v1 currently being beta tested.
