Relativity Autonomous Distribution Blocks
The relativity method is a method of trade inspired by the Theory of Relativity of Albert Einstein , which argues that trade is a relative concept and, according to the case it advocates, creates the values to be evaluated relatively by using various engineering methods, and converts these values to factors to ensure the highest efficiency.
Many layers are common with Autonomous LSTM.
For more information about Autonomous LSTM :
But there are additional layers that are much higher than that.
These systems use COT (Commitment of Traders) data positively in trade and significantly increase the hit rate compared to conventional methods.
And in all traded instruments, it decides the degree of scoring by linking with global markets.
The more liquidity of the selected parities, the higher the success rate, the higher liquidity in the markets.
***STRUCTURE
Feature Layer 1 : Formulation : Common Layer with Autonomous LSTM
Feature Layer 2: Forecast Algorithm : Common Layer with Autonomous LSTM
Feature Layer 3 : Composite of Two Layers : Adaptive Period (Length) Algorithm : Common Layer with Autonomous LSTM
Feature Layer 4 : High - Low Selection Algorithm : Common Layer with Autonomous LSTM
Feature Layer 5 : Volume (Ticker ) - Open Interest (Global Market) Power Factor according to Global Markets and Related instrument (Ticker)
Feature Layer 6 : Quantum Equations including COT Commercial Positions (Communicate with layer 5)
Feature Layer 7 : World's Price/Earnings Ratio (This layer is automatically added to layer 6 as a factor each week.)
Feature Layer 8 : Distribution Blocks : The design of script as a histogram, with distributional buying and selling points and positive/negative zone coloring, with alerts.
Uses the relativity algorithm. This will contribute not only to leveraged transactions but also to portfolio management and will give a more realistic perspective.
Informs the trading points within the regions.
In this way, it allows for gradual buying and selling and reduces the risk to a much lower level.
These feature allows a difference perspective especially for traders who act with portfolio logic and / or add regular income.
The educational idea I shared in order to set an example for this logic:
***SETTINGS
Menu
1. * Market Type
The menu is divided into 5 different algorithms and covers all instruments around the world.
For example:
Futures : XAUUSD , GC , XAGUSD , SUGARUSD , SB1! , XAGUSD
Stocks : All Stocks and Modified Parities (Example : AAPL/EUR , XAU/XAG , AAPL , MT , BAC)
Forex Excluding USD/X : CHFUSD , EURUSD , EURJPY , AUDNZD
Forex USD/X : USDJPY , USDTRY , USDMXN
Crypto : BTCUSD , ETHUSD , ADAUSD or BTCETH , ETHBTC
2. * Barcolor
Barcolor Plotting Rules : On / off section with these rules when barcolor on :
Orange : Distributional Sell Signal ( Not Short )
Blue : Distributinaol Buy Signal
*** FEATURES
Indicator Features :
Red Background with Cross : Short Signal
Green Background with Cross : Buy Signal
Blue Histogram Color : Distributional Buy Signal
Orange Histogram Color : Distributional Sell Signal
Alerts
Long Alert
Short Alert
Distributional Buy Alert
Distributional Sell Alert
*** USAGE
Since the script uses various Commitment of Traders data, it is designed only for the weekly time frame. ( TF = 1W )
Script does not repaint 1 Week and above time frames . (Source = close )
NOTE :
The script design was inspired by one of RafaelZioni's script :
Best regards.
어큐물레이션 / 디스트리뷰션 라인 (ADL)

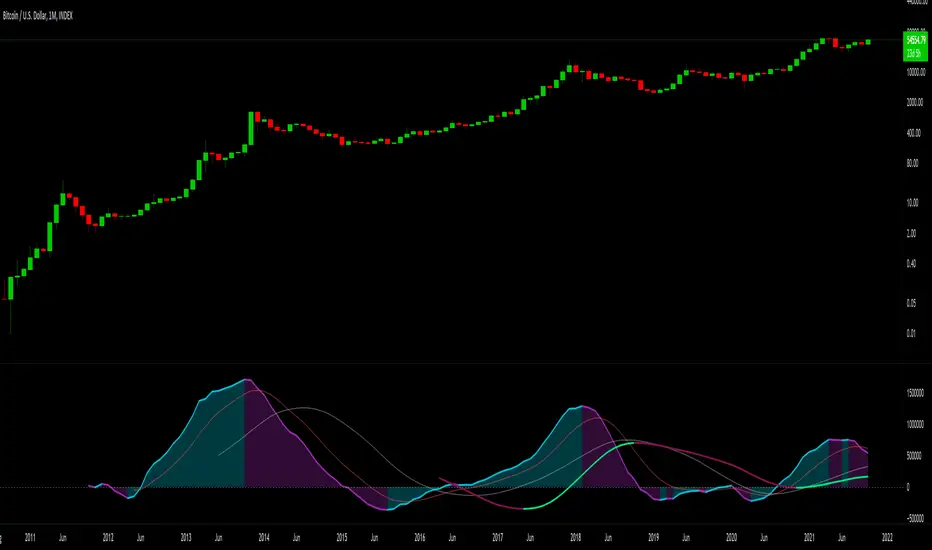
Whale Trading SystemThis script is an advanced version of the distributional blocks script.
In distributional buys and sells:
I used a high - low cloud filter, which makes it more prudent to sell the next sell higher for sells and to buy the next purchase lower for buys.
I also used the Stochastic Money Flow Index function because it also uses volume to separate regions.
The long period is 52 weeks, which is equal to one year,
The short period is one-fourth of its value, which is equal to a financial quarter.
Then the values calculated with these periods are calculated by stochastic - rsi logic within the function, giving us two averages and separating the regions according to crossovers and crossunders .
In buys and sales, the higher your next distributional position size makes your profit more .
In the old system, there was a confusion as it was not divided into zones.
Because we divide into zones here, zone changes are the last stop to free up existing positions, and you must reopen each time you change zones.
And I changed standard distribution days, depending on the price change and the histogram, as StochMFI also took into account the volume.
In this way, there is sustainability.
I am also sharing my educational idea that explains the logic of this system in more detail :
Now that we have been divided into regions, a maximum of 10 pieces will suffice us.
And the regional shifts will allow us to sell and buy all of our position size, and now we will feel much more comfortable.
The most timeframe I find most accurate are the weekly bars.
Even in the example, we see how we have benefited from the sharp drop in bitcoin, while the price is falling, and we have lowered the average with higher-weight purchases than the previous one.
In both buys and sales here, both the histogram intensities and the average of the purchases you have reduced with the transactions, or the earnings you have increased with the sales, guide you.
In areas with high volatility ,if we adjust our positions properly, even if we follow the changes in the region, we will get rid of those situations with few wounds and we will surely catch the trend!
NOTE : Crossover/crossunder and distributional buy/sell alerts added.
Best regards , Noldo.

DELTA7DELTA7 (Advanced Chart overlay)
DELTA7 System is a full-featured system with an advanced chart-overlay and an augmented RSI oscillator that doesn't require any further indicators.
It's a complete solution focused on being simple and minimal for a traders/investors that want to make decisions based on price, trend, momentum and market structure.
AOOAOO is just working with volume so it's perfect for cryptocurrency and refers if the people are buying or selling.
Long ==> background is green
short ==> background is red

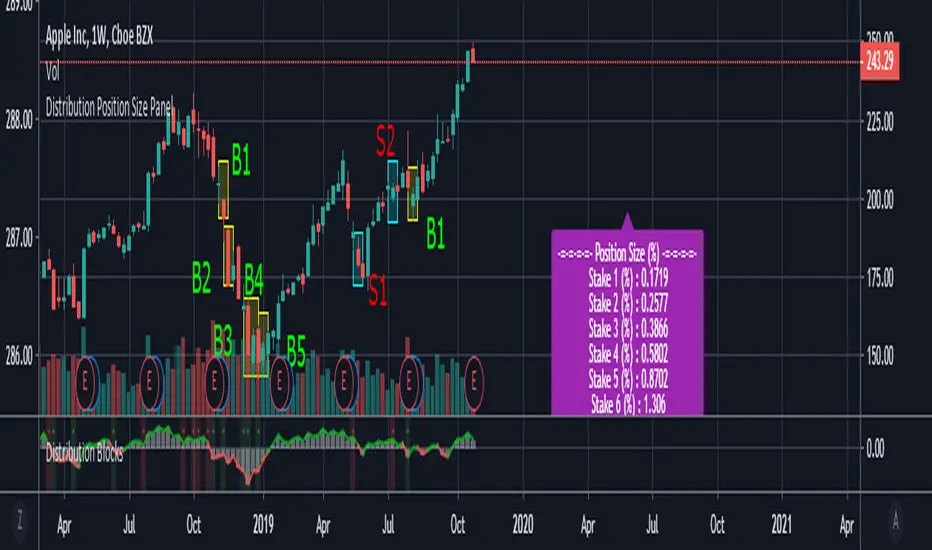
Distribution Position Size Panel
This panel is an example position size panel that I prepared and I consider the rates reasonable.
I have prepared this panel so that the money allocated to the investment ends 14 consecutive signals.
The sum of the ratios is 100 units.
You can adjust your positions according to this panel.
The first steps are low rates.
If the phrases are strong, you can specify a position size from the lower digits.
Likewise, when you make a big profit, you can empty your profits in the lower steps.
In the event of a color change, you can return to the beginning or lower limit.
NOTE: This script is an auxiliary command to the distribution blocks script,
if you want to use another script, you can add distribution days to yours.
14 th stake does not appear in the preview, you need to reduce the size of the distribution blocks indicator slightly.
Rafael Zioni's examples of the panels helped a lot, thanks to him.
Stay tuned ! Regards , Noldo.
Distribution BlocksThis idea has been created by the combination of the two existing systems as a result of my efforts to create a distributional buying and selling guide that has plagued my head for a long time.
1st idea is Accumulation / Distribution Line :
2nd idea is Distribution Day :
These two ideas, the intellectual assistance of professional brokers, and my observations of cot data played a role in the formation of this idea.
Let's start.
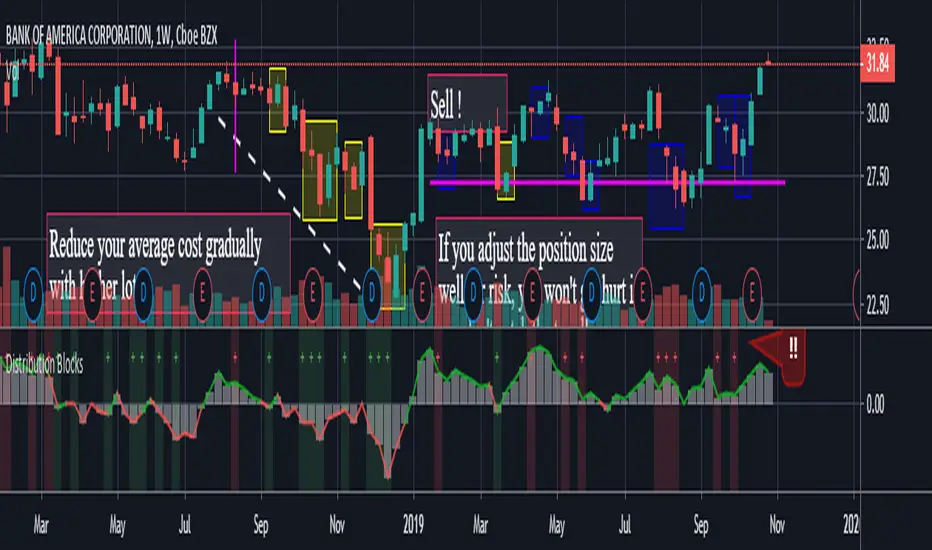
No matter how often we divide our risk, both our minds are not comfortable and our capital may end at any moment, and if we do not use professional systems, our chances of success are 50 percent.
If we take this system as an aid to our classic systems, we can determine the amount of risk with those predictions and gradually trade.
If we don't use leverage and we have a little predictive ability, our chances of success go above 50 percent.
But for the first time, we can keep our first lot very low and increase the number of positions in the same order of orders (example: buy and buy and buy).
If we keep the first amount low, the folds won't hurt us.
When we catch up with the trend, purchases with larger position sizes than lower prices lower our average price, so that we can make a good profit when the rising trend starts.
By accepting the zone changes as the reset point just like in the martingale system, we enter the folds in the new zone with our first lot weight.
Although we cannot catch the trend, we determine the stoploss level by adding the first point we entered or the first point we entered and the commission cost.
In fact, this method is the method of buying and selling very large traders and producers, banks, pro-brokers, hedge funds and in other words the new popular phrase "whales".
Because if he trades otherwise, he cannot find buyers because his goods are too big.
I like the comfort of mind in this way.
Finally, your methods separating the negative and positive regions (macd, rsi, interpretation observation etc.)
the stronger you are, the higher your success rate.
I think the Accumulation Distribution method is very successful, but it can be adjusted for the period.
I can't wait to integrate my relativity system on this.
And when my deep learning series is over, I will integrate them on ANN series and share them publicly.
To start with, I can say briefly.
If your capital is 100:
(first lot + (increase multiplier * first lot) + (increase multiplier * increase multiplier * first lot) + .....) = 100
I tell you that you can have the same position in this series 10 - 15 times,
this will help you decide how small a position size is to be used as the starting rate and choose a low increment multiplier!
I think that this idea cannot be converted into strategy, because when our expectations come true, we may want to free all positions and start again.And I think that's better.
And in sudden movements and developments we take action with different expectations.
I'm going to talk about this script's calculations and profits on educational ideas.
Regards , Noldo.
Hashem Accumulation/Distribution (V2)Hashem Accumulation/Distribution. Accumulative Net Delta.
Accumulation/Distribution Line with the Histogram of it. Basically shows the buyers and sellers on a move and trend.
Can analyze it to verify if the volume in a trend is confirming it or not.
Added markers when it cross the 0 Line in a Distribution. (after Accumulation) and Vice Versa.
Can be used for the Histogram Divergences and the A/D Line Slope logic for identifying a trend that is supported by the Volume.
Biitfinex ETH Longs+Shorts// version 1.0 alerts of 4 types just testing things out
//@version=3
study("Biitfinex ETH Longs-Shorts")
shorts = pow(security("BITFINEX:ETHUSDSHORTS", period, close),1.0)
plot(shorts, title='Bitfinex Shorts', color=red)
longs = pow(security("BITFINEX:ETHUSDLONGS", period, close),1.0)
plot(longs, title='Bitfinex Longs', color=green)
dif=longs+shorts // calculate difference
plot(dif, color=black, title="Difference") // plot difference

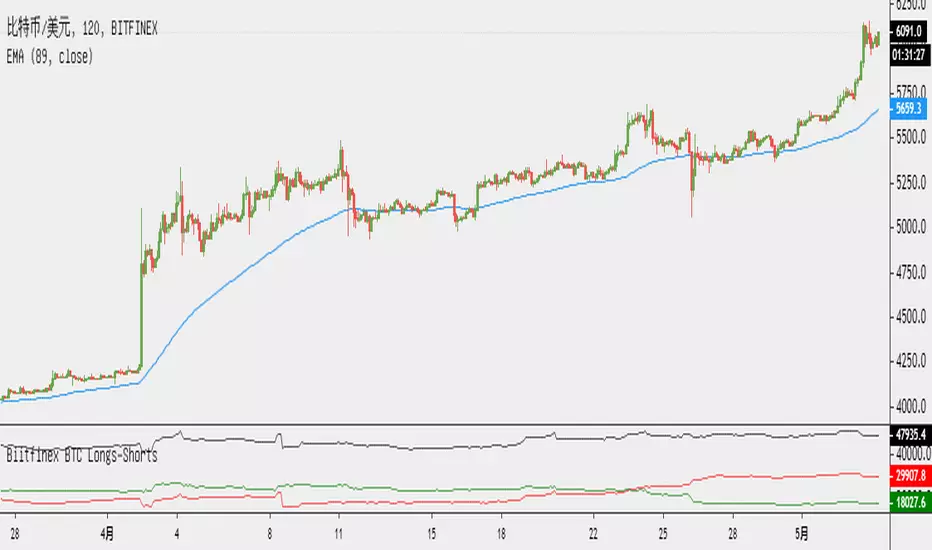
Biitfinex BTC Longs-Shorts// version 1.0 alerts of 4 types just testing things out
//@version=3
study("Biitfinex BTC Longs-Shorts")
shorts = pow(security("BITFINEX:BTCUSDSHORTS", period, close),1.0)
plot(shorts, title='Bitfinex Shorts', color=red)
longs = pow(security("BITFINEX:BTCUSDLONGS", period, close),1.0)
plot(longs, title='Bitfinex Longs', color=green)
dif=longs+shorts // calculate difference
plot(dif, color=black, title="Difference") // plot difference

TH_Accumulation/Distribution+Custom Accumulation / Distribution indicator enhanced with a cloud formed by moving averages for longer term bias.
Beware the way Acc/Dist indicator should be used is to map the levels and swing points to identify supply levels and not focus too much on the clouds.

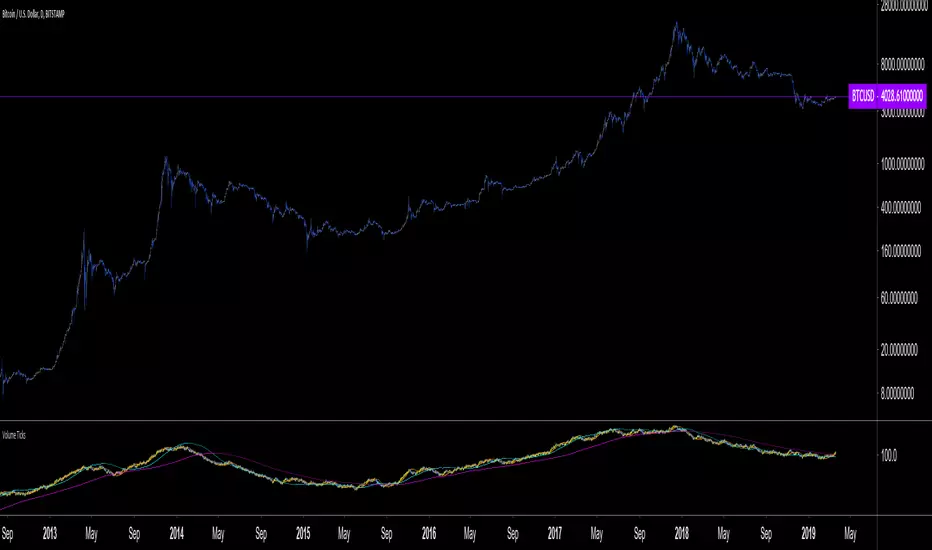
Volume Ticks - Increasing Volume Bar Count [LucF]Volume Ticks is a zero-lag market sentiment indicator. It works by providing a cumulative count of increasing volume columns.
A one count is added for each increasing volume column where close>open, and one is subtracted on an increasing volume column if close
Volume Squeeze Momentum by HypesterTradingview is basically composed by reskins of many great contributors such as Chrismood, Lazybear, RicardoSandos and a few others. Without those guys I would not be able to learn how to code PINE - since the "documentation" is horrible and support is basically also non-existent. So thank you!
So here is another contribution to the community, which I chose to not disclose the code since the community usually reskin the code and do not give credit and this code is 100% mine.
I believe that the volume tools available are poor and lagging so here is my contribution.
I use this tool to filter noise and eliminate fake reversal signals, momentum readings and trend changes on my Spectro M. Use at your own risk.
I've added some pre-set volume profiles and trend configs. Also, the bar colors for ease of use, and all of that can be easily turned on/off and changed in the config menu.
Let me know what you think!

Distribution Days-BuschiThis script is a simple extension of the script "Distribution Day" from user "kalle2017". Thanks to him!
As the name suggests, the idea is to recognize "distribution days", when the "firm hands sell to the shaky hands" (Kostolany). So, too many distribution days in a certain timeframe can be a sign for a coming correction / bear market.
A distribution day gets triggered when a loss compared on the day before exceeds 0.2 % and the trading volume is higher.
This indicator works on any daily chart symbol but should be primarily used on major indexes.
Possible inputs are "days back" to count how many trading should be examined(default: 25). Additionally, I implemented the possibility to draw a moving average (default: exponential, 50), to eliminate distribution days below, because it is more of an indicator for the upside. Perhaps a little bit too much / too complicated, therefore it is off by default.


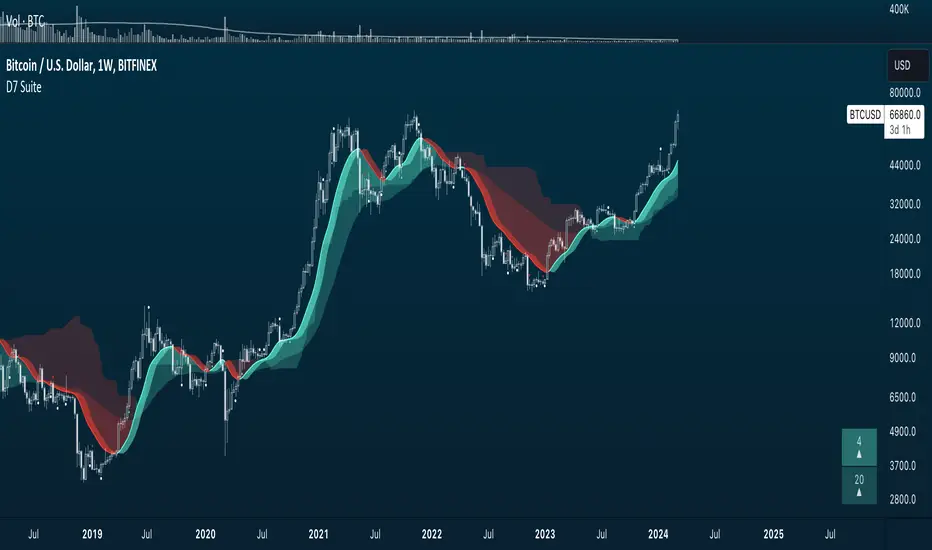
📊 Advanced Charts Suite v2.1 by 🇨🇷🇾🇵🇹🇴🇷🇹🇭🇾🇭🇲🇸📊With the advanced charts suite you get multiple indicators you can overlay on your charts, while only using one indicator slot.
🎁We made this after requests from our members, to assist those who use a free TV account. Its not advised to use them all at once, use them in combinations and see what works for you!
🕥 It can take a minute or more to load... be patient! I wanted to include more indicators, but hit some of the limits imposed by pine script. All options are off by default.
📊 Indicators Included are:
✅Ichimoku Cloud
✅Support Resistance Fractal
✅Trailing Long/Short Stoploss
✅Bull Bear Squares
✅Triple Hull Moving Average
✅Standard Hull Moving Average
✅Fibonacci Daily
✅Advance Decline Lines
👍If you enjoy the Charts Suite, please like the indicator, and follow me on TradingView!
💬Come chat with us in telegram (link in signature) if you have any questions or would like a trial of a premium indicators (linked below).

IO_EMA_Delta_OscillatorThis is a EMA Delta Oscillator: An attempt to show ranging markets based on the slope of the EMA.
Green = Bullish Market
Blue = Ranging Market
Red = Bearish Market
The EMA Slope is normalized to make it work like an oscillator with values between 0 and 1.
Bar colors show the oscillator colors, bar borders show the actual candle colors.
- Invsto
(sarangab)

XBT Volatility Weighted Bottom Finder. [For Daily Charts]An update to:
Made it into and indicator.
v. 0.0.1
DESIGNED FOR DAILY CHARTS

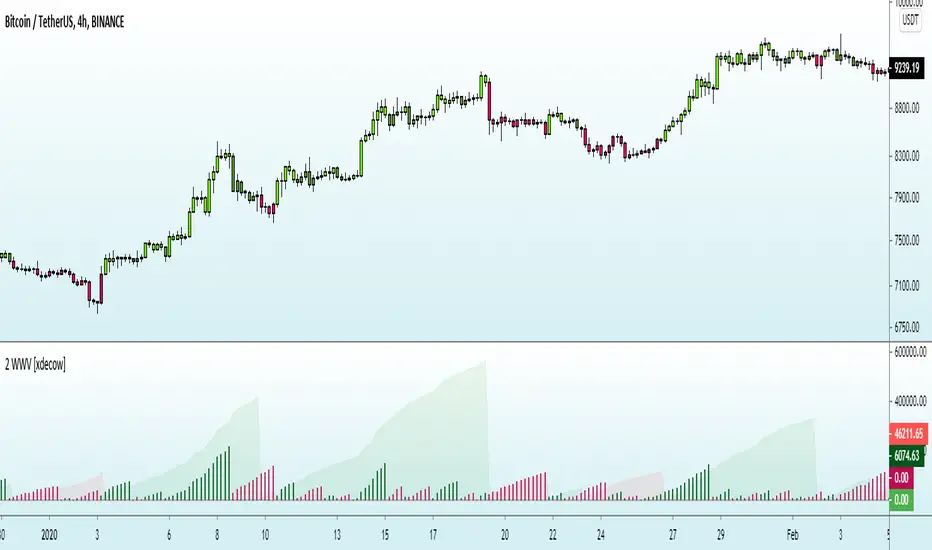
Accumulation/Distribution Volume (ADV) [cI8DH]This is the simplified and optimized version of my original ADV indicator. It shows both regular volume bars and the accumulated/distributed (A/D) portion of them. The equation is elegant and intuitive. It calculates candle body to candle height ratio and multiplies it by volume: volume*(close-open)/(high-low). This is the building block of my three other indicators, ADL, ADP and ADMF.
- The volume bars has two shades of green and red. The dark shade shows amount of A/D and the light shade shows total volume (what you see on a regular volume indicator).
When money volume is enabled, volume is multiplied by price. As you can see in the chart below, trade volume in terms of USD was growing over the past years.
- Blue line is the moving average of A/D and the orange line is for total volume. When "Baseline Chart" option is enabled, this moving average is identical to ADMF indicator which can be a powerful indicator for assessing buy/sell pressure as well as money flow and volume divergences. You can turn off volume bars (from style menu) for better visibility or you can use the below indicators.
Please note that ADMF is now available as a part of ADP indicator as well and I recommend using the latter since ADP can also replace CMF and MFI indicators.
- If you change the aggregation to cumulative (while having money volume disabled), the gray line becomes identical to On Balance Volume (OBV) and the blue line identical to my ADL indicator. The latter I would argue is more accurate than Chaikin's ADL, William's A/D and OBV.

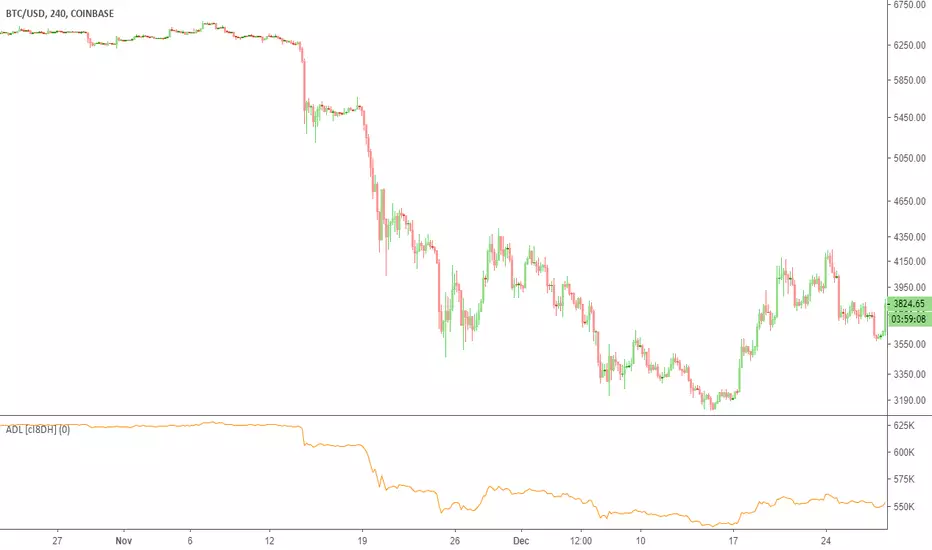
Accumulation/Distribution Level (ADL) [Cyrus c|:D]This indicator shows Accumulation/Distribution level which can be used for confirming trends or reversals (via divergence). It is an alternative to Chaikin's Accumulation/Distribution Line (ADL) and On Balance Volume (OBV) indicators. It can also replicate PVT and OBV via options in the input menu.
Here is a comparison of four related indicators:
OBV is too simple and has serious flaws as explained in PVT's wiki.
Chaikin's ADL is a broken indicator as can be seen in the chart below:
A/D Level addresses the flaws in these two indicators. It simply sums up portions of the volume that contributes to price change. These portions are visualized in dark green and red on "Accumulation/Distribution Volume (ADV)" indicator. This can also be achieved by ADV indicator if you are nerd enough.
PS: There is Williams A/D as well which is also a broken indicator.
Accumulation/Distribution VolumeThis is a simple yet powerful indicator that can replace volume, Money Flow, Chaikin Money Flow, Price Volume Trend (PVT), Accumulation/Distribution Line (ADL), On Balance Volume (OBV).
When "Baseline Chart" option is disabled, it looks similar to regular volume. The volume bars has two shades of green and red. The dark shade shows amount of accumulation and the light shade shows total volume (what you see on a regular volume indicator). Blue line is the moving average (or cumulative total) of A/D and the gray line is for total volume.
When money volume is enabled, volume it multiplied by price. As you can see in the chart below, trade volume in terms of USD was declining after ATH. This is not the case in regular volume chart which shows instrument volume (chart above).
In Baseline view, the aggregation method you choose can turn it into different indicators. With EMA/SMA aggregation, blue and gray line shows buy/sell pressure. At 0, there is not buy or sell pressure.
If you turn off volume bars (from style menu), it gives you a reliable indicator to measure divergence. This should be more reliable than most other range-bound indicators (i.e. RSI, MFI, CMF). I will publish a TA about correctly measuring divergence (it's a must read even if you are a pro trader). Make sure that the length is set to a large number on smaller TFs such as 4h.
For following results, set aggregation to cumulative and turn off money volume:
When wick weight=0, the GRAY line is identical to OBV indicator.
When normalized by spread and wick weight=10, the BLUE line is identical to ADL (improved by true range).
When normalized by previous bar price, wick weight=0, the BLUE line is identical to PVT.
How I use this indicator:
- Baseline chart, replaced my regular volume indicator
- Mostly 4h TF for divergence
- EMA aggregation (and occasional cumulative aggregation) with length above 50. I change the length to 100 and 200 for confirmation.
- Wick weight=0 or max 2.
With this indicator, you can learn how different indicators are built and how they are different from each other. I will publish a TA to explain more about different indicators and their pros and cons.
I will publish this indicator without volume bars and additional options to make it range bound.
