Bitcoin Halving Rainbow + S2F Model PriceOverview
The rainbow price line:
This script creates a colorful view of Bitcoin's price action, where different colors indicate the time until the next halving date. The color scale in the top right highlights what each main color group represents in terms of days until the next halving. Using historical data, the simple indication of days until the next halving has somewhat accurately predicted potential bottoms and tops of market cycles. Comparing current colors to previous cycles provides a rough view of where BTC is in its current cycle and what to expect going forward until the next halving date.
In addition to the colored price action, I have incorporated the stock-to-flow model price for Bitcoin.
The stock-to-flow (S2F) model price:
The stock-to-flow ratio is a calculation that aims to estimate how many years are required to produce the current stock of an asset, based on the current production rate. When applied to Bitcoin, we simply divide the total amount of bitcoins in circulation by the amount of bitcoins mined in a certain timeframe. Once we have this value, we can calculate a model price based on the stock-to-flow ratio. This S2F model price uses a 463-day moving average. Preston Pysh came up with this number as he believed Bitcoin cycles happen in three phases: bull run, correction, and a reversion to the mean. He estimated there are about 200,000 blocks per cycle, three phases per cycle, and ~144 blocks per day. Dividing all three gets us 463. I have removed 1,000,000 coins from this calculation to account for Satoshi's coins.
The process I took to plot this model price (credit to PlanB for originally creating this calculation):
-Declare constant variables for the halving period, starting block reward, and the number of coins Satoshi owns.
-Fetch the block index by using the request.security() function.
-Determine the number of halvings that have occurred by dividing the block index by the halving period.
-Calculate the current block reward by multiplying the initial block reward by 0.5 raised to the power of the number of halvings.
-Calculate the number of blocks mined per period (day or week) and derive the stock (total bitcoins in circulation minus Satoshi's coins) and flow (annual block rewards) from it.
-Calculate the S2F ratio by dividing the stock by the flow.
-Calculate the S2F model price by applying a mathematical formula (ModelPrice = exp(-1.84) * S2F to the power of 3.36) along with a 463-day moving average.
** Please note, due to the use of the 463-day MA, the first ~400 days of the S2F model price is not entirely accurate.
In addition to the above, I have added vertical lines on each halving date, along with labels that have a tooltip if you hover over them, which will show more information about that particular halving.
Important tips:
-This script has been designed to work on the 1-Day timeframe but can also work on the 1-Week timeframe. Any other timeframe will not accurately plot all the information due to the way I have developed the script.
-This script is best used on the ticker I have posted this on, "INDEX:BTCUSD". It can also work on "BLX" or "BITSTAMP:BTCUSD".
-Hide candles when using the script to just show the halving rainbow (hover over the symbol name in the top left and press the eye icon).
-Right-click the price scale and select "Scale price chart only" to get a better view of the plots.
-Right-click the price scale and select "Logarithmic."
-I will update the script as time goes on to show future halvings along with adjusting the next halving date as we get closer (if it changes).
Settings Menu:
Tooltips are included explaining what the settings do, but here's a quick summary:
-'Show Vertical Halving Lines?': Default is true. This allows the user to remove the vertical lines shown on each halving date.
-'Show Halving Labels?': Default is true. This allows the user to remove the info labels shown on each halving date.
-'Halving Line and Label Color': Default is white. This allows the user to change the color of the halving lines and labels to better fit their chart layout.
-'Show Stock to Flow Model Price?': Default is true. This allows the user to remove the S2F model price.
-'Stock to Flow Model Price Color': Default is white. This allows the user to change the color of the S2F model price to better fit their chart layout.
-'Draw Color Table?': Default is true. This allows the user to remove the color table in the top right of the chart.
-'Distance rainbow is away from actual price action': Default is 0 (Plots over candles). This allows the user to adjust where the halving rainbow is plotted if they would like to also see candles on the chart. (Use any value under 0.9)
Feel free to message me or comment on the post with any questions or issues!
Much more to come!
Thanks for reading, enjoy!
1-BTCUSD

basilPort Portfolio Tracker Pro [basilChart]This script is helps giving detailed information about the portfolio.
Prominent features of this portfolio tracking indicator are:
- Chart of your portfolio: This portfolio tracker let’s you view the chart of your portfolio real-time.
- Visualized Profit/Loss: Indicator will let you know of your profit and loss on the chart.
- In-Depth Monitoring: Most Gained 1st, 2nd, 3rd and Most Lost 1st, 2nd, 3rd.
- All Time Highs: Let’s us view All Time Highs on the portfolio chart for each equity on the chart.
- 40 Different Symbols: Supports monitoring 40 different symbols at the same time, real-time.
- 10 Pair Detailed View: For the first 10 symbol in our portfolio, indicator supports viewing detailed info about each of them. Such as: Price, Cost, Qty, Profit Percentage, Chart TF Profit Percentage, Weight
basilPort Portfolio Tracker Pro indicator can be used to:
- Track your investments: The basilPort Portfolio Tracker allows you to enter all your investments and their associated details, such as the ticker symbol, purchase price, and quantity. It then calculates your total portfolio value, including gains and losses.
- Monitor portfolio performance: Provides an overview of your portfolio's performance over time. You can see how your portfolio is performing on a daily, weekly, or monthly basis, and compare it to the performance of the overall market.
- Analyze asset allocation: Helps you analyze your portfolio's asset allocation, which is the percentage of your portfolio invested in different symbols. You can use this information to adjust your portfolio and diversify your holdings.
- Set investment goals: You can use the Portfolio Tracker to set investment goals and track your progress towards achieving them. For example, you can set a goal of achieving a certain rate of return or accumulating a specific amount of wealth by a certain date.
Overall, the Portfolio Tracker is a useful tool for investors who want to monitor their portfolio's performance, evaluate their investment strategies, and make informed investment decisions.
Best and worst 3 performers in our portfolio:
From Data Window, script let’s us see the best and worst 3 performers in our portfolio. To know how to read it we follow this pattern:
- Check 1st Gained value.
- Find the nth symbol from script’s Inputs tab.
- Check 1st Gained to see its Profit Percentage.
An example scenario to reading Data Window is explained at the very end of the description.
Using the script:
- Add this script to the chart from indicators tab
- Set starting date for the basilGrid Portfolio Tracker Pro either by dragging and dropping the vertical line or by the date-time picker from indicator Inputs tab.
- Set symbols and enable them to monitor with this indicator.
- Set quantity and price information for the symbols you have selected.
- Set visual settings to tailor your experience.
basilPort Portfolio Tracker is an indicator that allows you to track and analyze the performance of your investment portfolio over time. It's a helpful tool for investors who want to monitor their holdings and evaluate their investment strategies.
In this example we used pair BTCUSDT 1h timeframe, our settings are:
Inputs Tab:
- Start Date: 2022-12-13 13:00
- Show All Time Highs: Unchecked
- Show Pair Data (First 10): Checked
- Show Total Data: Checked
Symbols:
- BINANCE:ETHUSDT Qty 4.2 Price 1 332
- BINANCE:BTCUSDT Qty 0.5 Price 17 469
- BINANCE:BNBUSDT Qty 20 Price 270
- BINANCE:AVAXUSDT Qty 200 Price 13.61
- BATS:PYPL Qty 50 Price 78.5
- BATS:AMZN Qty 40 Price 95.4
- BATS:ETSY Qty 40 Price 135.64
For example, if you check Data Window, you'll see the following:
An example scenario:
- Bought Portfolio Value 39142.98 => The cost of the portfolio
- Current Portfolio Value 39142.98 => The current value of the portfolio
- 1st Gained 2.00 => The most gained symbol's index. (Checking the Symbols what we see on the 2nd spot is this symbol, we can see this value indicates BINANCE:BTCUSDT)
- 1st Gained 28.09 => Means BINANCE:BTCUSDT is +%28.09
- 2nd Gained 4.00 => Again, after checking the Symbols, we now know what this value indicates. It is AVAXUSDT.
- 2nd Gained 18.59 => Means BINANCE:AVAXUSDT is +%18.59
..
And so on to Lost section. Only difference between Gained and Lost section indicates Lost equities.
This script's purpose is to make easier to have more control over the portfolio. With in depth data that’ll help with decision-making.

ATR fluctuation abnormal warning RTA77 1.0//en
ATR fluctuation abnormal warning RTA77 1.0
COINBASE:BTCUSD
"coming? "
A classic technical term for impending volatility. But "coming" generally means that the question of whether volatility or a trend is coming is asked only after volatility has been observed.
By combining short-term volatility, long-term volatility, and abnormal changes in relative cycles, this indicator identifies potential changes in upcoming volatility (volatility changes) at an earlier stage, allowing the market to be asked the question "Is it coming?
Since volatility itself has a lag, and the longer the period, the more lagged the detection of abnormal volatility will be, so this indicator is only suitable for short-term, small period (15M - 1H) best. Because volatility is passed from small to large, there is a chance to detect large volatility quotes by catching potential volatility abnormal changes in small cycles.
The "volatility warning" of this indicator all refers to the plate is in abnormal volatility, or is about to occur volatility anomaly, can be used as a precursor warning of the emergence of volatility anomaly in the later market. When a golden cross between short-term volatility and long-term volatility is observed, it means that in a short period of time, or in the future, a high volatility market will be profitable in contrast to the previous low volatility market.
(Alert triggering is not only limited to a single time, if it is confirmed several times in a short period of time, if volatility has not yet occurred, the probability of volatility in the future market increases in the short term)
This indicator of "shock warning" all refers to the plate may have been from the previous state of high volatility, into a low volatility of the shock state, orderly or disorderly, suggesting that volatility in the short term appeared to reduce the higher the volatility of the previous section of the market, when the shock warning signal, the probability of starting to enter the shock adjustment market.
The ATR of two different cycles can be changed as needed, but must maintain the relationship between short-term and long-term correspondence, each subject has a different cycle, you need to judge and find the optimal parameters
Continuously updated.
//ch
ATR波动异常预警 RTA77 1.0
《来了?》
一个经典代表波动即将来临的专业术语。但“来了”一般情况下指有当人们观察到波动以后,才会发出对市场的提问,波动或趋势是否到来?
本指标通过结合短期波动率,长期波动率,在相对周期内的异常变化表现,从而在更早的阶段发现即将出现波动的潜在变化(波动率变化),使得能够更早的向市场提出疑问《来了?》
由于波动率本身具有滞后性,且周期越长,发现波动异常的时候就会越滞后,所以本指标仅适合在短期,小周期里使用(15M - 1H)最佳。因为波动是从小到大传递,所以通过抓取小周期内潜在的波动异常变化,从而有机会发现大波动行情。
本指标的 “波动预警” 皆指的是盘面正处于异常波动,或者即将发生波动异常,可做为对后市出现波动异常的前兆预警。当观察到短期波动与长期波动金叉时,意味着在短时间内,或者未来将盈利与之前低波动行情相反的高波动行情。
(警报触发不仅限单次,如在短期内多次确认时,如还未发生波动,则后市短期内出现波动概率增大)
本指标的 “震荡预警” 皆指的是盘面可能已经从之前的高波动状态,转变为低波动的震荡状态,有序或无序,提示短期内波动率出现降低,前段波动幅度越高的行情,当出现震荡预警信号时,则大概率开始进入震荡调整行情。
两条不同周期的ATR可以按需要更改,但必须保持短期和长期对应的关系,每个标的有着不同的周期,需要自行判断并找出最优参数
持续更新中。。
BTC / DXY, BTC / US10Y
The combination of the DXY and US02Y can be used to gauge market sentiment and assess the state of the global economy.
When the DXY is rising, it indicates that the U.S. dollar is strengthening relative to other currencies, which can lead to increased risk aversion among investors as the U.S. dollar is often seen as a safe-haven currency.
When the US02Y is rising, it suggests that market expectations for future inflation and interest rate increases are increasing, which can lead to a decrease in the value of riskier assets such as stocks.
In general, the combination of the DXY and US02Y can provide important information on the direction of global market trends and the state of the economy, and as such, they are important indicators to consider when making investment decisions.

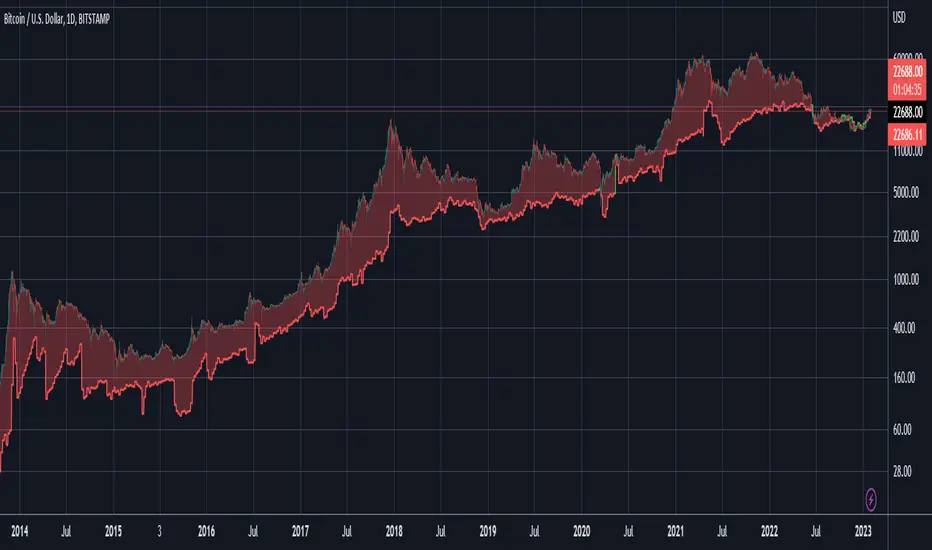
Price Distance RatioThis study plots the ratio between current price and the price N days ago.
With N input that is configurable, users can find optimal long/short entries when price is in an established trend and price has diverge far from a given local peak or all time high.
With many years of stock trading the analysis indicates a connection between the distance of price and subsequent returns.
Portfolios of stocks with lower price to local highes ratios generally underperformed portfolios of stocks with higher prices to peaks reached similar N days ago.
The highest returns to previous peak are recorded when buying at the biggest dip.
For example, the purchase at 20% drawdown could generate 25% when price returns to the peak. The purchase at 50% drawdown could generate bigger, i.e. 100% return, when price returns to the peak. And the purchase at 90% drawdown could generate much bigger, i.e. 900% return, in a case the price returns to the peak.
However, buying very far below local peaks on almost all holding periods produces lower CAGR returns because of "timing adjustment". In simple words, typically the drawdown takes less time vs. further recovery.
For example:
👉 The largest BTC drawdown in 2013-2015 took 410 days (Peak-to-Valley) . And the recovery of BTC to new highs took 771 days (Valley-to-Peak) after that.
👉 The 3rd longest drawdown in BTC took 363 days (observed from December 17, 2017 to December 15, 2018). And further recovery in BTC to its new high took almost two years - 716 days .
👉The 4th longest drawdown in BTC took 162 days (observed from June 08, 2011 to November 17, 2011). And further recovery in BTC to its new high took more than a year - 469 days .
The concept of this study could recognizes at least 4 different modes of action.
👉 In a clearly established upward trend traders should be buying (following the trend) when Ratio is above 100% and reducing the size when Ratio turns below 100%.
👉 Conversely, in a clearly established downward trend traders should be shorted when Ratio is below 100% and covering when the Ratio turns back to 100%.
👉 In a sideways movement traders are advised to wait carefully if the Ratio near 100% for a long time, and take a position the trend is clear.
👉 Chartists can analyze the dynamic of the indicator - both in terms of trends and overall level. For example as it shown at the chart.
The understading of the study and rules of "timing adjustments" could genarate the awesome opportunities for stock options traders also, with strategies of selling uncovered call options and vertical call spreads.
// Many thanks to @HPotter and @Wheeelman wizards for their continious support and assistance.

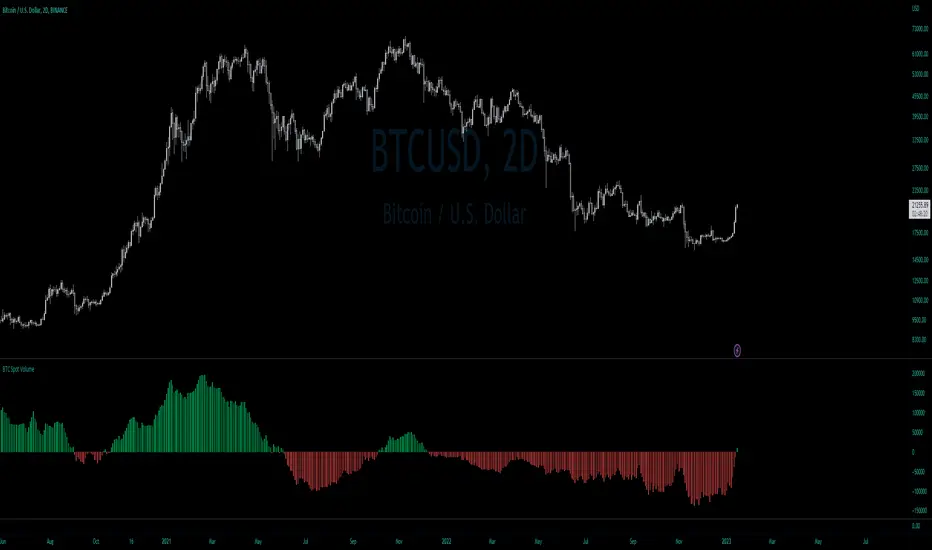
BTC Net Volume (Spot) (by JaggedSoft, fixed by SLN)• WHAT:
This indicator plots the aggregated net volume delta of BTC spot pairs from 8 exchanges over the last 60 periods (default settings).
Tracks the following pairs:
"BINANCE:BTCUSDT"
"BITFINEX:BTCUSD"
"POLONIEX:BTCUSDT"
"BITTREX:BTCUSDT"
"COINBASE:BTCUSD"
"BITSTAMP:BTCUSD"
"KRAKEN:XBTUSD"
"BITGET:BTCUSDT"
"GEMINI:BTCUSD"
• HOW TO USE:
Used for confirmation when watching futures that can experience quick movements in the form of liquidation-events. If the oscillator is green or trending upward, it's confirming a positive bias. The inverse is true for a negative bias. This is especially true on higher timeframes.
Can also be used to find correlations between different tech-assets.
• NOTES:
I forked JaggedSofts indicator to fix the data-source error it was having. Let me know if you want to customize exchanges or add more pairs, maybe I can add that in the future!
This indicator replaces the outdated alternative linked here : Please only use this one
• LIMITATIONS:
Only tested with normal japanese candlesticks .
• THANKS:
to the creator of this script, JaggedSoft. It's a great indicator!
• DISCLAIMER:
Not financial Advice, use at your own risk.
True Bitcoin Value USD - Mario MThe average mining costs of one bitcoin equals to the true intrinsic value
Globally, the Bitcoin network uses around 0.5% of the world’s electrical power supply.
The sheer amount of electrical power and complex hardware required to operate a mining farm has intrinsic value.
This gives bitcoin a fundamental cost to create, and thus intrinsic value.
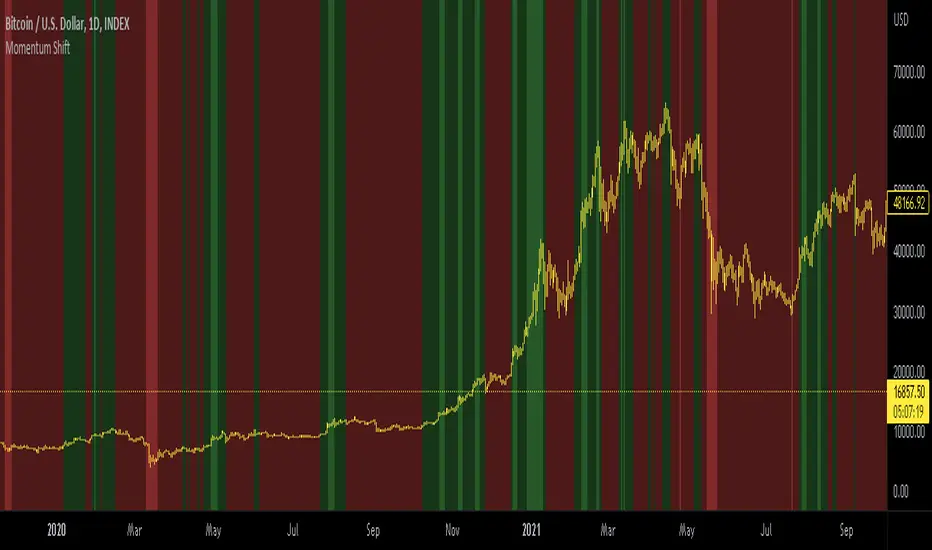
Momentum shift CCI, MACD, RSI, AligatorIndicator for BTC only.
This indicator combines CCI MACD RSI AND William's alligator.
Bullish macd cross, RSI over 50, bullish William cross and positive CCI result in green background. Otherwise red background is displayed.
For better visibility extreme values can be displayed with greater color saturation. 1D BTCUSD is best with default values.
For other TFs Bull side and bear side values can be tweaked.
For bright red we may assume price to be `greatly oversold.
For bright green we may seek some profit taking.
QT suppy demandV1.0 core functions: marking supply and demand areas, marking air decoy/multiple decoy signals, and displaying potential target positions in tables
1. What kind of indicator is this?
This is a practical trading indicator based on supply and demand, which combines many of my practical experience and marks the supply/demand area through complex and accurate calculation, so that you can better identify where the organization has orders, so that you can buy chips at a lower price and sell them to retail investors at a higher price
2. What is the relationship between supply and demand?
Demand: In terms of price, if the market falls short of demand, then the price will stop falling and start to rise
Supply: In terms of price, if the market is oversupplied, then the price will stop falling and begin to fall back
In short, the higher the price, the lower the demand. From the perspective of the seller, the higher the price, the higher the supply
3. What is the supply and demand area?
The supply and demand area is generally the place where the price is reversed, and the price reversal will generally occur in the area where the supply and demand are unbalanced, which is the entry point of the high profit loss ratio we are pursuing
4. Who is your opponent?
Retail price: the price close to or within the supply area is called retail price
Wholesale price: the price close to or within the demand area is called wholesale price
Retail investors generally buy at the "retail price" and sell at the "wholesale price", while professional traders do the opposite, so professional traders are often retail investors' opponents
Professional traders often buy back the chips of retail investors at the wholesale price, and then sell them to retail investors at the retail price
5. How to use this indicator?
: flat down, up flat down, down flat down
(1) Flat fall: yellow+red K line combination is the supply area flat fall combination, which belongs to bearish. Usually, this form requires confirmation of entry, that is, the price can only be sold after it enters this area and stops rising.
(2) Up and down: The combination of green+yellow+red K line is up and down in the supply area, which is bearish. Usually, the form in the pipe is only operational when it occurs at the inflection point of the reversal, or the position of the superimposed supply area can improve the success rate of selling.
(3) Falling flat: red+yellow+red K line combination is the supply area falling flat, which belongs to the bearish area. Usually, the reversal in the market is completed by rising flat falling+falling flat falling. Only those falling flat at the high or middle level have operating prices, and the success rate at the low level is slightly lower
: flat rise, falling flat rise, rising flat rise
(1) Flat rise: yellow+green K line combination is a flat rise in demand area, which is bullish. Usually, this form requires confirmation of entry, that is, the price can only be bought after it stops falling in this area.
(2) Falling flat and rising: red+yellow+green K line combination is a falling flat and rising demand area, which belongs to bullish. Usually, this form can achieve the best profit loss ratio at the low inflection point. Because its bit occurs during inversion.
(3) Inflation leveling: The combination of green+yellow+green K line is a demand area for inflation leveling, which belongs to the bullish. Usually, the neutral form will occur after the occurrence of inflation leveling. The transition from short to long also requires the completion of inflation leveling+inflation leveling, except for the case of negative V.
matters needing attention:
(1) Please do not trade in a large supply and demand area, because stop loss may exceed your risk tolerance.
(2) Please do not trade in a small supply and demand area because there may be very few orders.
(3) The K line leaving the supply and demand area is called the outgoing line. The outgoing line is the big positive line or the big negative line, which belongs to a very full entity. The success rate of the supply and demand area depends on the physical fullness of the outgoing line. The fuller the entity is, the higher the transaction success rate is, of course, it is not an absolute value.
So the core point of supply and demand is to find the demand area to be long and the supply area to be short, so as to ensure a high winning rate and a good profit loss ratio
=========================================================================================================
中文说明:
V1.0 核心功能:标记供给、需求区,标记诱空/诱多信号,表格显示潜在目标位
1、这是一个什么样的指标?
这是一个以供需为基础的实战型交易指标,里面结合了很多本人的实战经验,通过复杂且精确的计算,标记出供给/需求区域,让你更好的识别机构在哪里有订单,让你以更低的价格购买到筹码,然后以更高的价格卖给散户
2、什么是供求关系?
需求:从价格层面来讲,若市场出现供不应求,那么此时价格将会停止下跌并开始回升
供给:从价格层面来讲,若市场出现供过于求,那么此时价格将会停止下跌并开始回落
简单地说,价格越高,需求量越低,从卖方的角度来看,价格越高越供应量越高
3、什么是供需区?
供需区一般都是价格反转的位置,价格发生反转一般都会出现在供求不平衡的区域,也就是我们所追求的高盈亏比入场点位
4、谁是你的对手盘?
零售价:接近供给区或者供给区内的价格我们称之为零售价
批发价:接近需求区或者需求区内的价格我们称之为批发价
散户一般都会以“零售价”买入,以“批发价”卖出,而职业交易员则相反,所以职业交易员往往就是散户的对手盘
职业交易员常常以批发价回购散户的筹码,然后通过零售价卖给追涨的散户
5、如何使用这个指标?
【看跌形态】:平跌、涨平跌、跌平跌
(1)平跌:黄色+红色K线组合为供给区平跌组合,属于看跌。通常这种形态是需要确认入场的,就是价格在进入这个区域之后止涨才可以卖出。
(2)涨平跌:绿色+黄色+红色K线组合为供给区涨平跌,属于看跌。通常管中形态是出现在反转的拐点位置才有操作意义,或者是叠加的供给区位置才能提高卖出成功率。
(3)跌平跌:红色+黄色+红色K线组合为供给区跌平跌,属于看跌区域,通常市场上的反转都是由涨平跌+跌平跌完成的,跌平跌在高位或中位的才有操作价格,低位的成功率略人低
【看涨形态】:平涨、跌平涨、涨平涨
(1)平涨:黄色+绿色K线组合为需求区平涨,属于看涨。通常这种形态是需要确认入场的,就是价格在进入这个区域之后止跌才可以买入。
(2)跌平涨:红色+黄色+绿色K线组合为跌平涨需求区,属于看涨,通常这种形态在低位拐点位置交易盈亏比才能达到最好。因为它位都是发生在反转的时候。
(3)涨平涨:绿色+黄色+绿色K线组合为涨平涨需求区,属于看涨,通常和中形态是在出现跌平涨之后才会出现,由空头向多头转变也是需要完成跌平涨+涨平涨才能实现,当然V反的情况下除外。
注意事项:
(1)太大的供需区请不要交易,因为止损可能会超过你的风险承受范围。
(2)太小的供需区请不要交易,因为他里面的订单可能会非常少。
(3)离开供需区的K线我们称为出线,出线就是大阳线或大阴线,属于实体非常饱满,供需区的胜率取决于出线的实体饱满程度,实体越饱满交易成功率越高,当然它不是绝对值。
所以供需的核心要点就是,找到需求区做多,找到供给区做空,这样才能保证胜率高的同时盈亏比也很好

Bitcoin Long Time Cycle Detection (RGB Box)Hi!
I tried to analyze bitcoin's cycles since the beggining at INDEX:BTCUSD (on 1D timeframe) using some tools like Moving Averages and Ichimoku Cloud and Fibonacci Levels based on ATH prices of each cyle. Each cycle type is represented by colors:
1- Green is when the price is going to have a new ATH compared to the last ATH
2- Red is when the price is going to move down from the last ATH
3- Blue is when the price seems not going down anymore and moving up go get to the last ATH
The result is very interesting because each cycle has similar behaviours. The Main cycle is when there is a Green, Red and Blue and then there will be a Green again for the new cycle.
Logic of detecting Red part some times makes a Red between two Green s (which is normal but it makes a bit difference in the behaviour of the last part of that shorter Red part) so the valuable part is the Blue !
You can see the interesting noticable similarity of the Blue 's price movement and duration (written in the boxes).
What I understood from this model about each part was:
In the Greens, strongest candles of the whole market appear with higher volumes. which are the shortest parts too.
in the Reds, we see a lot of hammer candles here, price moves down step by step (unless it is going to have a NEW ATH which makes the duration of Red part vert shorter than the main Red parts before the Blue). Temporary resistances make some range channels but finally the price will go down a lot!
in the Blues, the main weak uptrend from the bottom which is finally going to see its last ATH price, but very slowly and weakly compared to the Green part. Some times there will be a lot of temporary downtrends too but in the end, price is going up. this part maybe the best time to buy for long time holding.
What makes this model interesting is that cycles match fundamental events like HALVING and periodic cycle analyses based on that.
In the last cylce we haven't seen the Blue Signal yet! so there should be alot of more patient till we say there will be no more down.
I hope it gives you more insight on the long term trend of crypto. I would be glad to hear your ideas to improve the model.

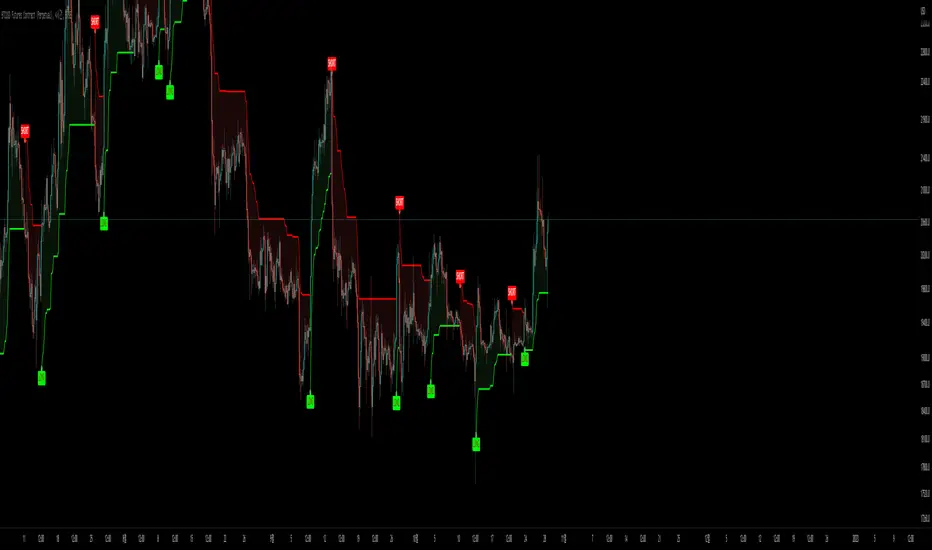
Makumup X Tesseract 2.2SuperTrend is one of the most common ATR based trailing stop indicators.
In this version you can change the ATR calculation method from the settings. Default method is RMA, when the alternative method is SMA .
The indicator is easy to use and gives an accurate reading about an ongoing trend. It is constructed with two parameters, namely period and multiplier. The default values used while constructing a superindicator are 10 for average true range or trading period and three for its multiplier.
The average true range (ATR) plays an important role in 'Supertrend' as the indicator uses ATR to calculate its value. The ATR indicator signals the degree of price volatility .
The buy and sell signals are generated when the indicator starts plotting either on top of the closing price or below the closing price. A buy signal is generated when the ‘Supertrend’ closes above the price and a sell signal is generated when it closes below the closing price.
It also suggests that the trend is shifting from descending mode to ascending mode. Contrary to this, when a ‘Supertrend’ closes above the price, it generates a sell signal as the colour of the indicator changes into red.
A ‘Supertrend’ indicator can be used on equities, futures or forex, or even crypto markets and also on daily, weekly and hourly charts as well, but generally, it fails in a sideways-moving market.
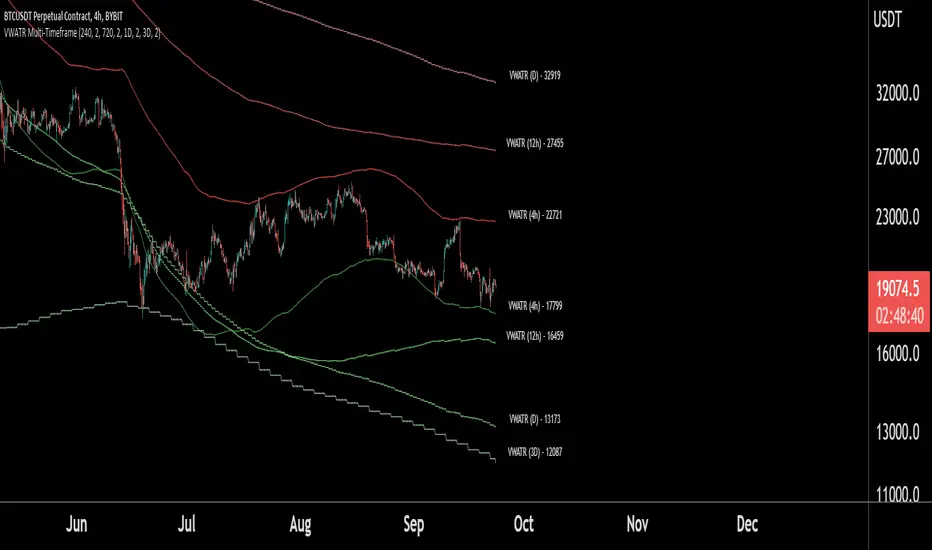
VWATR Multi-Timeframe RibbonThis script combines and averages Volume-Weighted Moving Averages in a specific way to make a unique ATR band that expands and retracts based on the volume in the current market.
This indicator allows for viewing up to 4 VWATR Bands on all the major trading timeframes.
This creates support and resistance levels that are fluid enough for traders to use these 4 methods:
- Identify a range to trade between in sideways markets.
- Identify when we are beginning a move(breaking out of the bands and using them as support to trade from).
- During a trend, traders can use higher timeframe VWATR Bands to identify take profits or potential rejection points.
- Identify when a trend may be over(losing the band as support after a breakout).
NOTE: This script will work fine on identifying crypto assets and stocks, but markets with different volume parameters will negatively affect the accuracy of this script.
BTC Twitter SentimentBTC Twitter Sentiment - shows the total numbers of all negative, neutral and positive Bitcoin related tweets.
On default settings, the tweets are plotted in red (negative) white (neutral) as well as green (positive). The three charts are stacked so the total number of tweets is easily discernible.
Furthermore, there's an optional smoothing setting in the options.
The Twitter Sentiment data is provided daily by IntoTheBlock; Since data is only updated once a day the graph might look chunky on lower timeframes, even with smoothing.

Volume Buy/Sell (by iammaximov)Buy/Sell Volume
Buy/Sell volume based on total bar amplitude (high/low price) and close/open (for calculate vbuy > vsell or vbuy < vsell)

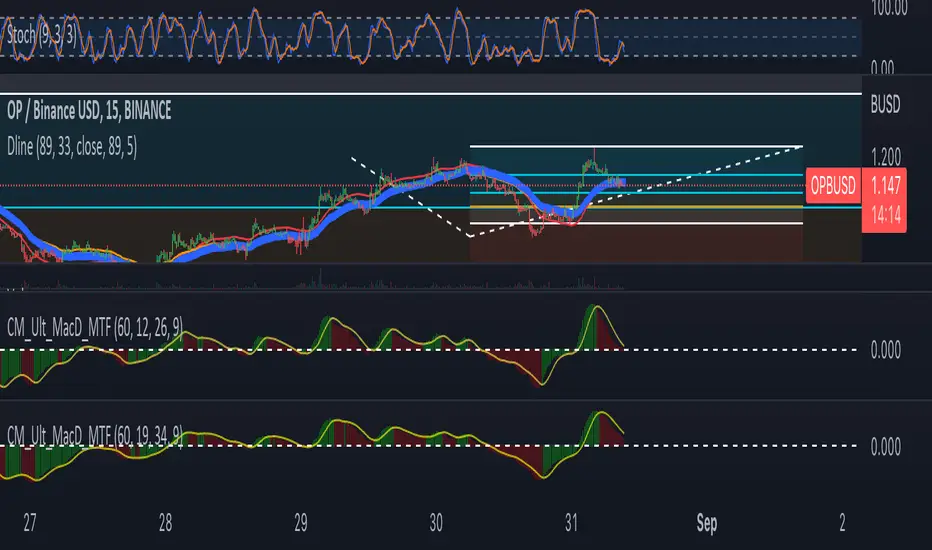
DlineDline is a indicator that was developed by B-Negative. This indicator was developed under convergence logic. If we have many information of prices, when the information was averaged with more enough, the average line will be the linear line that has direction. The direction of this linear line can help traders to analyze the direction of trends. Dline was made with TEMA, EMA, DEMA, and Dline line that is a average line between DEMA and EMA.
Under B-Negative's concept, DEMA and EMA that are average lines will convergence and have same direction when the trends are coming. Amount of data must more enough and diferrect by assets' type. However, user can change value of DEMA, Dline, EMA, and TEMA by themself under 7 concepts below.
1. EMA will convergence to close Dline when the trend will be changing.
2. The uptrend will occure when EMA above/below Dline and candle sticks are green/red color.
3. TEMA was setted similair DEMA.
4. When new high/low of wave cross TEMA and can not retrun to create higher/lower high/low (At oversold/overbought, Stocastic 9,3,3 counting with loop technique), that is exit point of position.
5. Difference of timeframe or assets could use different parameters. (Setting based on 4 rule above.)
6. Divergence between Dline and EMA mean sentiment of assets are sideways.
7. If Dline and EMA look like same line, the trend is most strength trend.
Dline use thickness = 4
EMA use thickness = 1
This ex. is timeframe day.
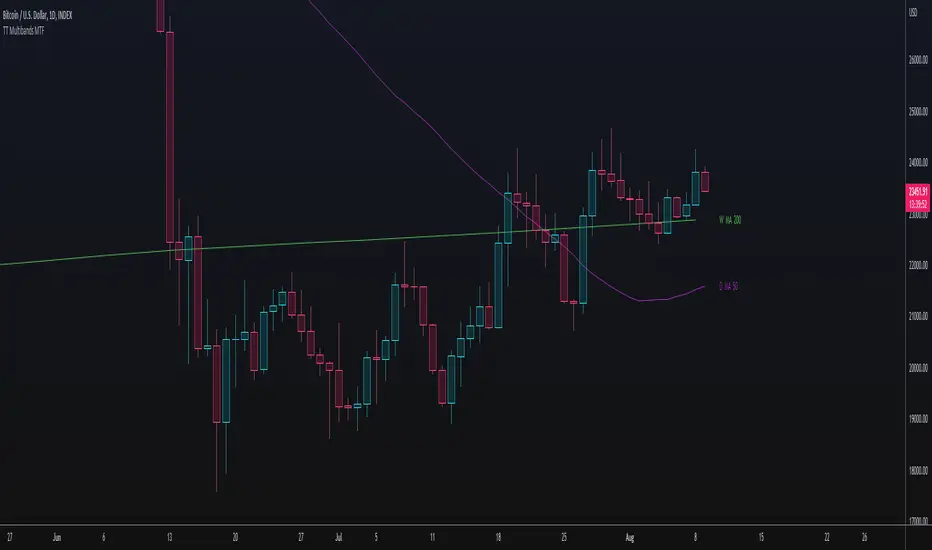
TT Multibands MTFThis Multi Moving Average Indicator is for a long list of Moving Averages:
- Simple Moving Average (SMA)
- Exponential Moving Average (EMA)
- Weighted Moving Average (WMA)
- Hull Moving Average (HMA)
- Double Exponential Moving Average (DEMA)
- Triple Exponential Moving Average (TEMA)
- Volume Weighted Moving Average (VWMA)
- Kaufman's Adaptive Moving Average (KAMA)
- Relative Moving Average (RMA)
- Arnaud Legoux’s Moving Average (ALMA)
Advantages:
- Auto Plotting the Lable: < TIMEFRAME + BAND TYPE + LENGTH >
- Multi TimeFrame (MTF)
- Usable with Custom Time Frames: You can choose any Time Frame out of your Custom Time Frame List
- "No Repainting"
- "No Gaps" on lower Chart Time Frames (HD, no "Stairs")
"No Repainting" and "No Gaps" TRUE
"No Gaps" FALSE
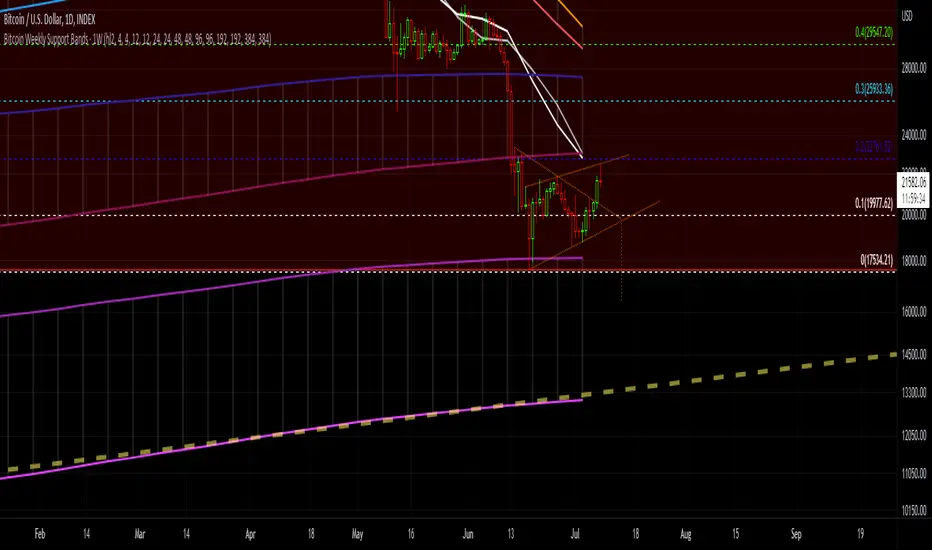
Bitcoin Support BandsSMA and EMA support/resistance bands for Bitcoin. Based on 4 week multiples; 1 month, 3 month, 6 month, 1 year, 2 year, 4 year.
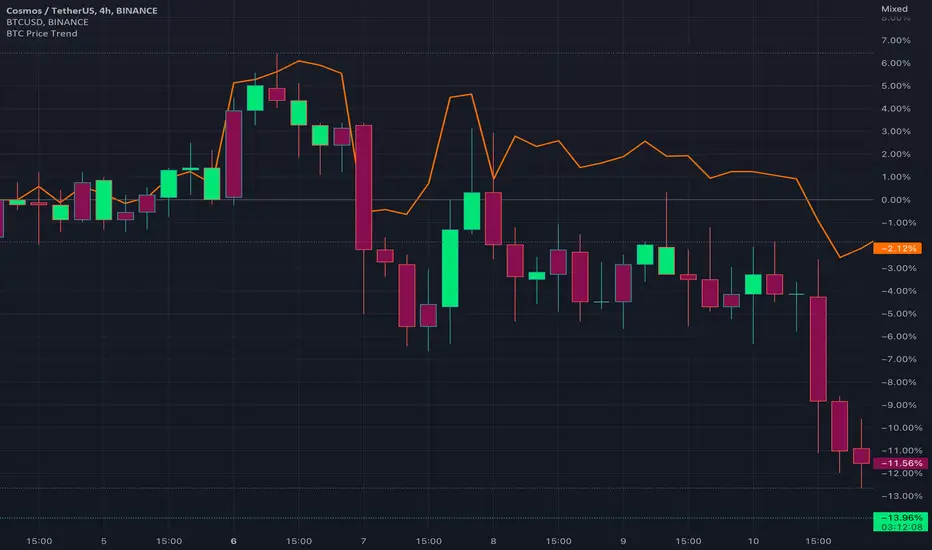
BTC Price TrendThe crypto market is reacting very quickly based on BTC price, thus monitoring the BTC price is very helpful.
This script will color the candles based on the BTC price trend. Set the timeframe and down/up percentage to monitor the BTC price trend, and the script should not repaint.
The indicator will monitor the BTC price in a high frame, for example, for 4 hours, if the price goes down the set percentage during one candle, will change the candle color. Thereafter, if the price goes up within a small timeframe (as you set) then the candle color will be changed.
So, in case the bar color is red, then it is recommended to avoid trading since the BTC price is down trending.
The indicator is requesting the BTC price as of now, and the previous closed price, then it will calculate the price difference, if it result is minus, then the price is in a downtrend, else it is in an uptrend.
RSI OverlayThis is the stock RSI index using the Price as the midline.
It can be useful to view information normally displayed in a second pane overlaid on the price chart. As far as I know, this has not been done for one of the most widely used indicators, the Relative Strength Index.
This can be overlaid anywhere on the chart and every parameter is variable. If you'd like to change the position, the RSI, midline, upper line, and lower line are scaled with a factor "*close/x"
To change the position on the chart, simply change the "X" until you are pleased with the location.
The RSI MA was distracting so I removed it. I also published this indicator including the MA, titled "RSI Overlay with MA."

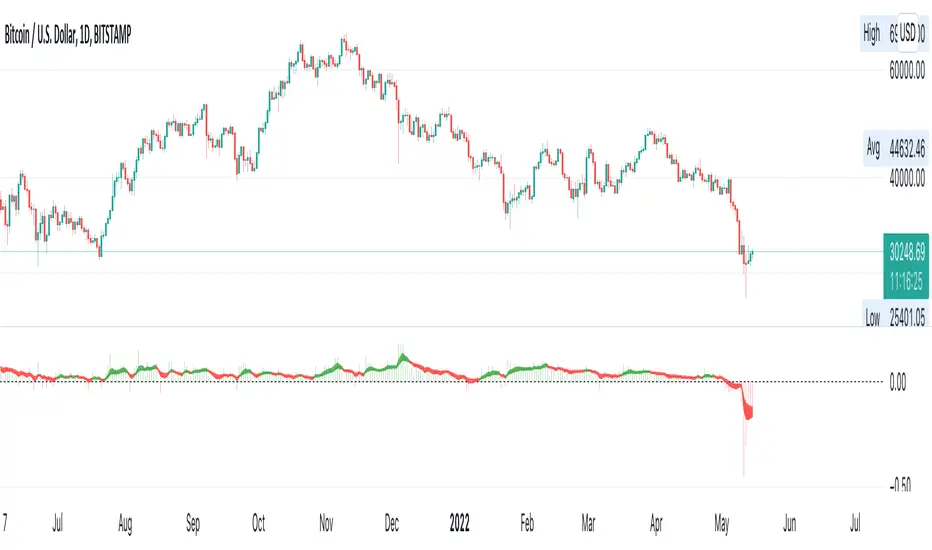
BTC Active Address Momentum (On-chain)This indicator shows the difference between the % change in BTC price and the % change in BTC’s active addresses (BTC’s utility value).
- Dark red: Extreme overbought conditions
BTC price is increasing too fast and outgrows the increase in its utility value
(RSI of % change difference > 70)
- Light red: Overbought conditions
BTC price is increasing too fast and outgrows the increase in its utility value
(RSI of % change difference > 60)
- Dark green: Extreme oversold conditions
BTC price is dropping too fast and outruns the decrease in its utility value
(RSI of % change difference < 30)
- Light green: Oversold conditions
BTC price is dropping too fast and outruns the decrease in its utility value
(RSI of % change difference < 40)
*Not financial advice.

Trend IdentifierTrend Identifier for 1D BTC.USD
It smoothens a closely following moving average into a polynomial like plot.
And assumes 4 stage cycles based on the first and second derivatives.
Green: Bull / Exponential Rise
Yellow: Distribution
Red: Bear / Exponential Drop
Blue: Accumulation
Red --> Blue --> Green: indicates the start of a bull market
Green --> Yellow --> Red: indicates the start of a bear market
Green --> Yellow: Start of a distribution phase, take profits
Red --> Blue: Start of a accumulation phase, DCA

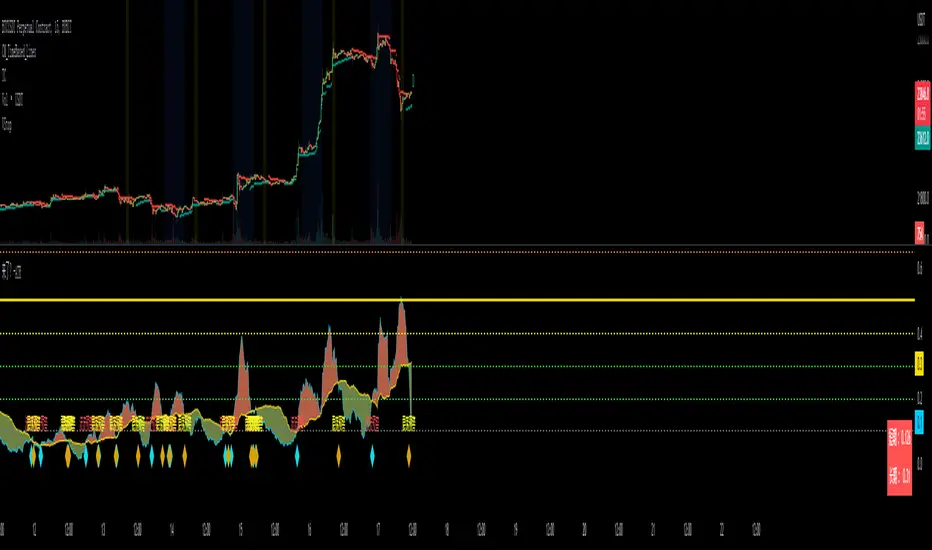
SOPR SignalThe script uses Glassnode's SOPR on-chain data to identify:
1. Sentiment Trends:
- Green circle on bottom (Bullish) -> Investors are selling in profits
- Red circle on top (Bearish) -> Investors are selling in losses
2. Short-term Entries:
- Small green circle on SOPR (Bullish) -> Approaching investor purchase price in bull run -> not willing to sell -> decrease supply
- Small red circle on SOPR (Bearish) -> Approaching break even price in bear run -> chance to get out -> increase supply
3. Potential Trend Change:
- Yellow circle on top/bottom -> Potential trend changing soon

BTC Coinbase Premium TrendBTC Coinbase (institutional trader) vs. Binance (retail trader) Premium
Positive values: Coinbase trading at a premium (institutions more bullish than retail)
Negative values: Coinbase trading at a discount (institutions more bearish than retail)