INVITE-ONLY SCRIPT
업데이트됨 Directional Analyzer

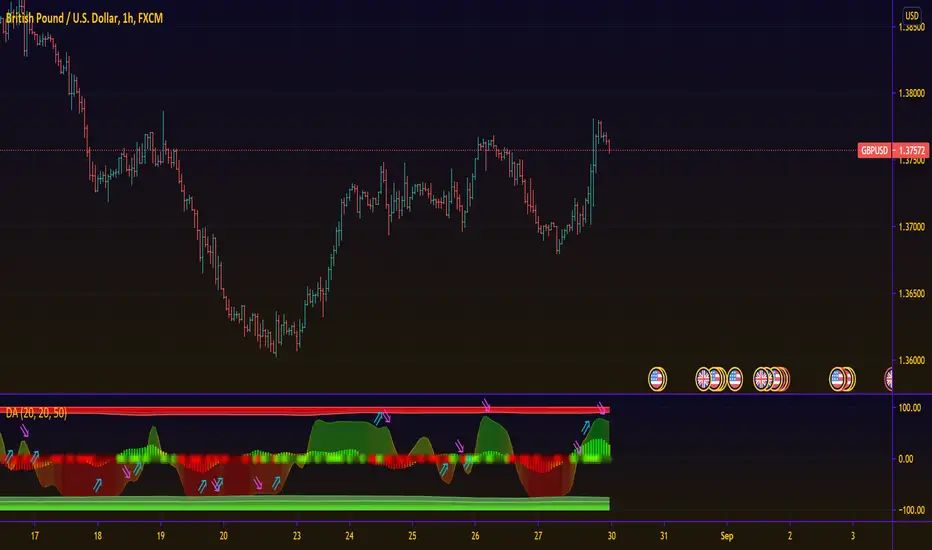
This script attempts to equip users with the necessary information about the direction of an instrument, and essentially it is a synergy of 3 algorithms.
The first algorithm (plotted as dots at level 0) studies the balance of delta volatility that constitutes the current bar and answers if bulls or bears are in control at that exact bar time
The second algorithm (plotted as an area) studies the development of delta volatility over the defined period by means of a polynomial regression. Effectively, it provides an overall picture of the trend strength.
The third algorithm (plotted as a line with arrow labels) utilizes simple elements of neural network in conjunction with some custom filters to predict the focal point that a trend will reverse its direction. This is predictive in nature, hence always adopt this with caution. While the labels display the predicted direction, the colors of the line also reflect the state of the current bar as well, adding to the confirmation of the first algorithm.
May you be on the right side of the trade.
릴리즈 노트
Update the logics behind the predictive models.Further clean up the code for faster execution.
릴리즈 노트
Major Update:- A new predictive algorithm has been included, and the correlation between this new one and the old one will be utilized to provide directional forecast now plotted as arrows. The line part has been removed due to underperformance in giving confirmation of direction.
- A self-optimizing filter has been added to the algorithms that analyze the current bar state (plotted as dots at zero line) and the overall strength of the trend (plotted as the area - now made parameterless). This filter significantly removes the lag and overshoots compared to without the filter
- A new algorithm has also been added (plotted as columns), which is based on my interpretation of entropy in information theory. This shall perform quite similarly to the area part, but tailored to usually lead the overall strength of the trend. This mean that the confluence of the columns part and areas part gives extra conviction to trend bias.
- Dynamic Overbought/ Oversold levels are introduced to identify potential trend reversal (usage: compared against the area part)
릴리즈 노트
Minor changes in default settings릴리즈 노트
Migration to Pine V5초대 전용 스크립트
이 스크립트는 작성자가 승인한 사용자만 접근할 수 있습니다. 사용하려면 요청 후 승인을 받아야 하며, 일반적으로 결제 후에 허가가 부여됩니다. 자세한 내용은 아래 작성자의 안내를 따르거나 QallianceTech에게 직접 문의하세요.
트레이딩뷰는 스크립트의 작동 방식을 충분히 이해하고 작성자를 완전히 신뢰하지 않는 이상, 해당 스크립트에 비용을 지불하거나 사용하는 것을 권장하지 않습니다. 커뮤니티 스크립트에서 무료 오픈소스 대안을 찾아보실 수도 있습니다.
작성자 지시 사항
Send me a direct message for life-time access request.
면책사항
해당 정보와 게시물은 금융, 투자, 트레이딩 또는 기타 유형의 조언이나 권장 사항으로 간주되지 않으며, 트레이딩뷰에서 제공하거나 보증하는 것이 아닙니다. 자세한 내용은 이용 약관을 참조하세요.
초대 전용 스크립트
이 스크립트는 작성자가 승인한 사용자만 접근할 수 있습니다. 사용하려면 요청 후 승인을 받아야 하며, 일반적으로 결제 후에 허가가 부여됩니다. 자세한 내용은 아래 작성자의 안내를 따르거나 QallianceTech에게 직접 문의하세요.
트레이딩뷰는 스크립트의 작동 방식을 충분히 이해하고 작성자를 완전히 신뢰하지 않는 이상, 해당 스크립트에 비용을 지불하거나 사용하는 것을 권장하지 않습니다. 커뮤니티 스크립트에서 무료 오픈소스 대안을 찾아보실 수도 있습니다.
작성자 지시 사항
Send me a direct message for life-time access request.
면책사항
해당 정보와 게시물은 금융, 투자, 트레이딩 또는 기타 유형의 조언이나 권장 사항으로 간주되지 않으며, 트레이딩뷰에서 제공하거나 보증하는 것이 아닙니다. 자세한 내용은 이용 약관을 참조하세요.