OPEN-SOURCE SCRIPT
Bank Nifty Market Breadth (OsMA)
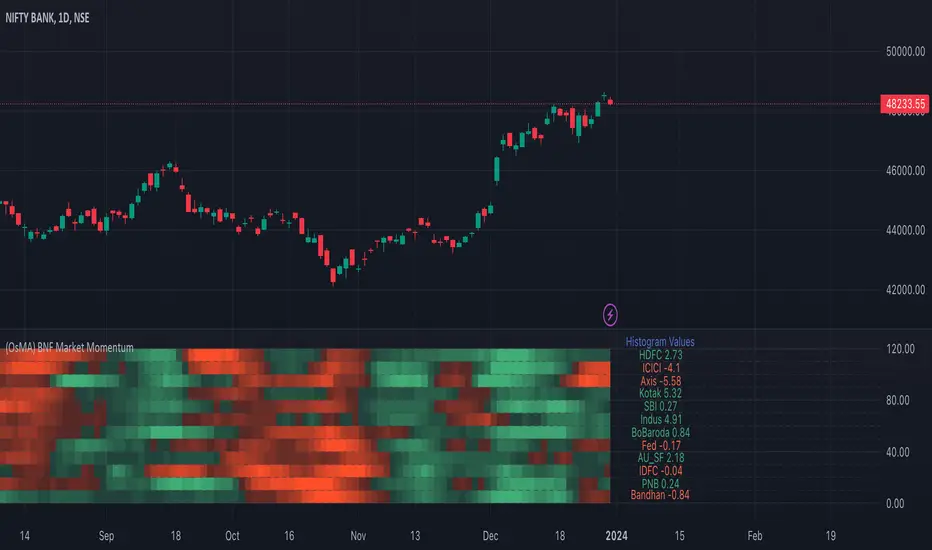
This indicator is the market breadth for Bank Nifty (NSE:BANKNIFTY) index calculated on the histogram values of MACD indicator. Each row in this indicator is a representation of the histogram values of the individual stock that make up Bank Nifty. Components are listed in order of its weightage to Bank nifty index (Highest -> Lowest).
When you see Bank Nifty is on an uptrend on daily timeframe for the past 10 days, you can see what underlying stocks support that uptrend. The brighter the plot colour, the higher the momentum and vice versa. Looking at the individual rows that make up Bank Nifty, you can have an understanding if there is still enough momentum in the underlying stocks to go higher or are there many red plots showing up indicating a possible pullback or trend reversal.
The plot colours are shown as a percentage of the current histogram value taken from MACD from the highest histogram value of the previous 200 bars shown on the current timeframe. Look back value of 200 bars was chosen as it provided a better representation of the current value from its peak over the recent past(previous 200 bars), on all timeframes. Histogram value do grow/fall along with the underlying stock price, so choosing the chart's all-time high/low value as peak was not ideal. Labels on the right show the current histogram value.
Base Code taken from fengyu05's S&P 500 Market Breadth indicator.
오픈 소스 스크립트
트레이딩뷰의 진정한 정신에 따라, 이 스크립트의 작성자는 이를 오픈소스로 공개하여 트레이더들이 기능을 검토하고 검증할 수 있도록 했습니다. 작성자에게 찬사를 보냅니다! 이 코드는 무료로 사용할 수 있지만, 코드를 재게시하는 경우 하우스 룰이 적용된다는 점을 기억하세요.
면책사항
해당 정보와 게시물은 금융, 투자, 트레이딩 또는 기타 유형의 조언이나 권장 사항으로 간주되지 않으며, 트레이딩뷰에서 제공하거나 보증하는 것이 아닙니다. 자세한 내용은 이용 약관을 참조하세요.
오픈 소스 스크립트
트레이딩뷰의 진정한 정신에 따라, 이 스크립트의 작성자는 이를 오픈소스로 공개하여 트레이더들이 기능을 검토하고 검증할 수 있도록 했습니다. 작성자에게 찬사를 보냅니다! 이 코드는 무료로 사용할 수 있지만, 코드를 재게시하는 경우 하우스 룰이 적용된다는 점을 기억하세요.
면책사항
해당 정보와 게시물은 금융, 투자, 트레이딩 또는 기타 유형의 조언이나 권장 사항으로 간주되지 않으며, 트레이딩뷰에서 제공하거나 보증하는 것이 아닙니다. 자세한 내용은 이용 약관을 참조하세요.