INVITE-ONLY SCRIPT
DMA AND SMMA
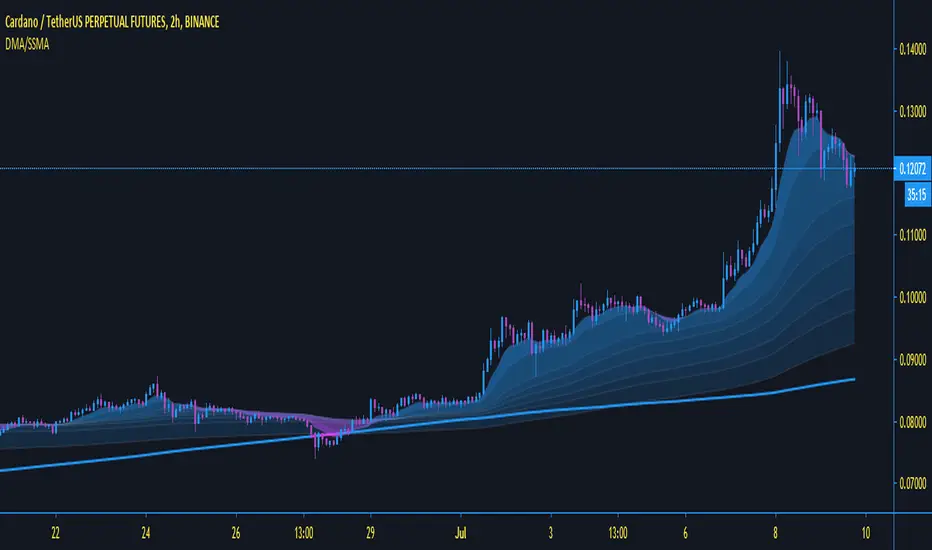
This "on chart" indicator is used purely as a visual sentiment to directional momentum of the pair you are looking at.
it is split into two parts, both of which i will explain below.
1, The SMA (purple and blue fading visual mas) this is used to find the directional momentum
2, the DMA (a slightly delayed Moving Average), is used to decide if the market is in a bullish or bearish move, hence determining whether or not to go long or short.
-only go long when price above DMA, and short, below.
i have found it very good at calling out bad trades, when the direction changes quickly.
same as all my other indicators this is fully adjustable in the settings.
i find, with the standard settings, it works best on the 2 hour timeframe as shown, but again, can be used on any time frame.
For access, send me a DM on TradingView
초대 전용 스크립트
이 스크립트는 작성자가 승인한 사용자만 접근할 수 있습니다. 사용하려면 요청 후 승인을 받아야 하며, 일반적으로 결제 후에 허가가 부여됩니다. 자세한 내용은 아래 작성자의 안내를 따르거나 Underdog-Trading에게 직접 문의하세요.
트레이딩뷰는 스크립트의 작동 방식을 충분히 이해하고 작성자를 완전히 신뢰하지 않는 이상, 해당 스크립트에 비용을 지불하거나 사용하는 것을 권장하지 않습니다. 커뮤니티 스크립트에서 무료 오픈소스 대안을 찾아보실 수도 있습니다.
작성자 지시 사항
면책사항
해당 정보와 게시물은 금융, 투자, 트레이딩 또는 기타 유형의 조언이나 권장 사항으로 간주되지 않으며, 트레이딩뷰에서 제공하거나 보증하는 것이 아닙니다. 자세한 내용은 이용 약관을 참조하세요.