PROTECTED SOURCE SCRIPT
업데이트됨 ZTrend
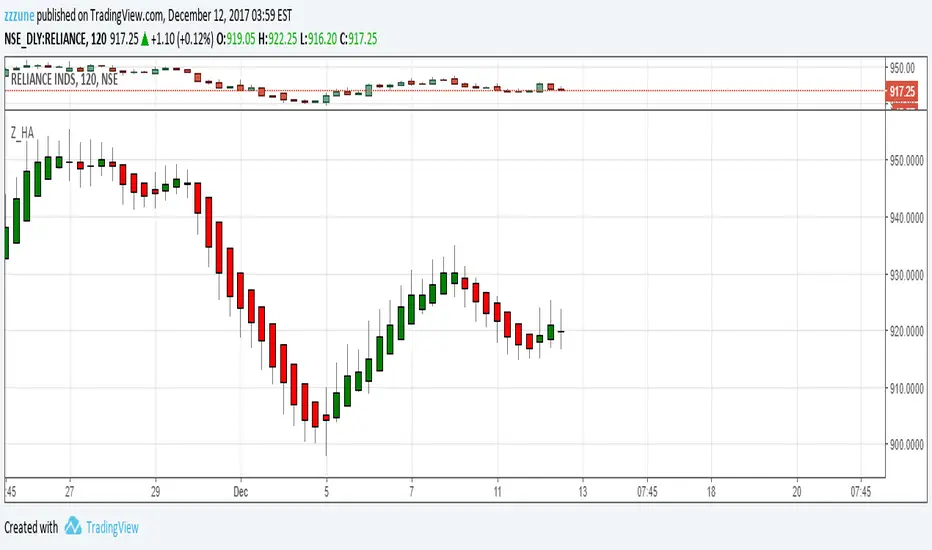
Pick Bottoms and Tops of a trend with ZTrend indicator. Use this indicator in multi frame for superb results.
If you are a Short Term trader, then use 2 hourly and Daily timeframe combination.
So after a downtrend, buy when 2 hourly candle turns green and wait until Daily candle also turns Green. Exit when 2 hourly candle turns red.
Ride the trend and do not exit until the 2 hourly candle turns Red.
When 2 consecutive candle body become thin, means end of a trend is near. Therefore either reduce the position or hedge.
Discipline is the key, therefore exit on the indication and do not wait in hope of marking turning your side.
릴리즈 노트
study("ZTrend", shorttitle="Z_HA", overlay=false)O = ema(open,3)
H = ema(high,3)
L = ema(low,3)
C = ema(close,3)
haclose = (O + H + L + C) / 4
haopen = na(haopen[1]) ? (O + C) / 2 : (haopen[1] + haclose[1]) / 2
hahigh = max(H, max(haopen, haclose))
halow = min(L, min(haopen, haclose))
plotcandle(haopen, hahigh, halow, haclose, title='Mod_HA', color=(haopen < haclose) ? green : red, wickcolor=gray)
릴리즈 노트
New update will plot ZTrend on the price chart itself.Use the Show/Hide button beside name of the instrument example show/Hide button just beside "NIFTY, 1D, NSE"
릴리즈 노트
Actual closing price of each bar now is also plotted in light blue line. This will help give an indication where exactly the actual price is with respect to ZTrend bars.보호된 스크립트입니다
이 스크립트는 비공개 소스로 게시됩니다. 하지만 이를 자유롭게 제한 없이 사용할 수 있습니다 – 자세한 내용은 여기에서 확인하세요.
면책사항
해당 정보와 게시물은 금융, 투자, 트레이딩 또는 기타 유형의 조언이나 권장 사항으로 간주되지 않으며, 트레이딩뷰에서 제공하거나 보증하는 것이 아닙니다. 자세한 내용은 이용 약관을 참조하세요.
면책사항
해당 정보와 게시물은 금융, 투자, 트레이딩 또는 기타 유형의 조언이나 권장 사항으로 간주되지 않으며, 트레이딩뷰에서 제공하거나 보증하는 것이 아닙니다. 자세한 내용은 이용 약관을 참조하세요.