INVITE-ONLY SCRIPT
(9) Count Closing Score & Long Tails VS-222
This indicator simply determines if the relationship of the close was close to the High or the Low of the day and provides you with a ten day running total. You are allowed to adjust what the actual proximity of the extreme parameters must be in order to be counted. The default is 10 for the low and 90 for the high.
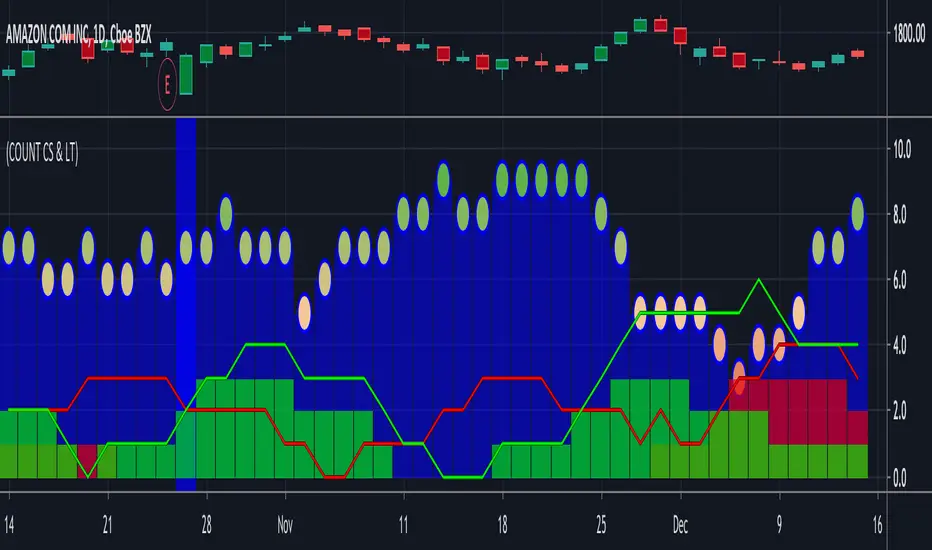
This indicator takes a ten day cumulative look at the Closing Scores, close to the low shown in red. The Closing Score's close to the high, show in green and finally the ten day count of the occurrence of long tails. Since this is calculated over a 10 day period of time, the scale is between 0 and 10.
Here again, you have an additional tool that provides you with the current sentiment, but just as importantly, how that sentiment is transitioning over time.
The blue columns indicate trading days that produced long tails and again provides you with a ten day running total. Because most institutional and all program trades are designed to be executed with a specific price range, when retail traders' orders are filled outside of these parameters the only orders remaining to fuel the market are orders who's prices are bracketed and thus will revert the trading range back into this channel producing a long tail in those trading days. Of course, there are other circumstances that can cause long tails, but when you see a series of days that all have long tails and the price trend is not changing dramatically combined with approximately equal trading volume for those days, you are in all probability seeing institutional and / or programed trades. You want to see this indicator above 8 before it is meaningful in my experience.
This is a very good thing to see if you are looking for stocks about to make a dramatic move and more often than not it will be to the upside.
Access this Genie indicator for your Tradingview account, through our web site. (Links Below) This will provide you with additional educational information and reference articles, videos, input and setting options and trading strategies this indicator excels in.
초대 전용 스크립트
이 스크립트는 작성자가 승인한 사용자만 접근할 수 있습니다. 사용하려면 요청을 보내고 승인을 받아야 합니다. 일반적으로 결제 후에 승인이 이루어집니다. 자세한 내용은 아래 작성자의 지침을 따르거나 StockSwinger에게 직접 문의하세요.
트레이딩뷰는 스크립트 작성자를 완전히 신뢰하고 스크립트 작동 방식을 이해하지 않는 한 스크립트 비용을 지불하거나 사용하지 않는 것을 권장하지 않습니다. 무료 오픈소스 대체 스크립트는 커뮤니티 스크립트에서 찾을 수 있습니다.
작성자 지시 사항
면책사항
이 정보와 게시물은 TradingView에서 제공하거나 보증하는 금융, 투자, 거래 또는 기타 유형의 조언이나 권고 사항을 의미하거나 구성하지 않습니다. 자세한 내용은 이용 약관을 참고하세요.