INVITE-ONLY SCRIPT
업데이트됨 Profit Accumulator Momentum Trend Indicator
Momentum Trend Indicator
This is a support indicator to the Main Indicator which has also been published.
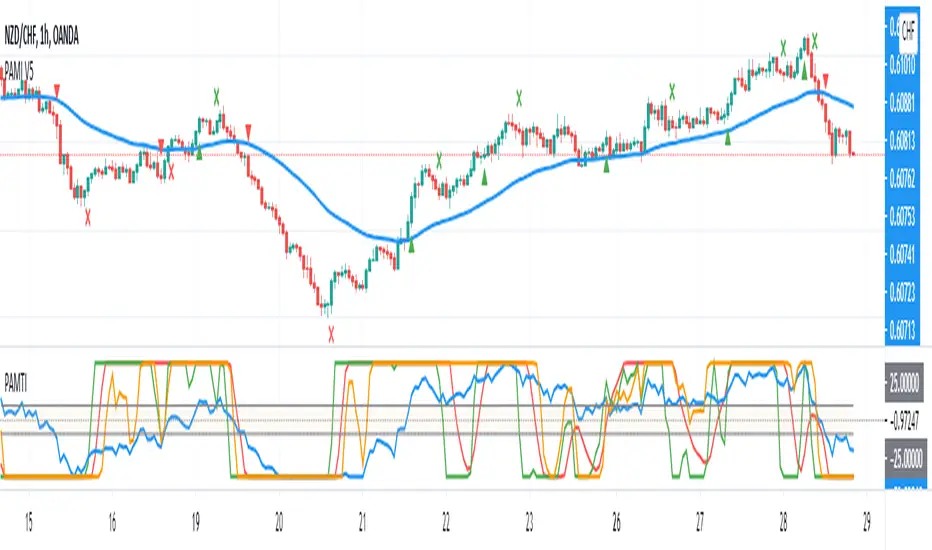
This indicator uses a modified stochastic trendline and a smoothed momentum line (which combines stochastic, RSI and moving average). This is a centred oscillator from -100 to 100 which makes it easier to track. The stochastic line is the quicker moving line which potentially acts as the first trigger. If the momentum line then begins to follow, then it is an indication that a trade should be made.
Whilst an actual alert function is not set for the indicator, the TradingView alert function can be used to trigger a message when either the stochastic line or momentum line crosses -25/25 (the key levels).
I've been using this successfully on the one hour FX charts, but seems to work equally as well on higher or lower time frames (not less than 15min).
The other indicators which are part of the suite are shown on the website which is highlighted in my signature at the bottom of the page. Purchase of the main indicator gives access to the full suite of eight indicators. I use the other indicators to confirm the direction of the trade and to determine if I want to trade or not. I use it along with the 2min, 15min and 4hr timeframes to identify the best entry window and how long I'm likely to be in the trade.
Support can be provided via private message or in the comments below.
The links are provided below for access to the indicator.
This is a support indicator to the Main Indicator which has also been published.
This indicator uses a modified stochastic trendline and a smoothed momentum line (which combines stochastic, RSI and moving average). This is a centred oscillator from -100 to 100 which makes it easier to track. The stochastic line is the quicker moving line which potentially acts as the first trigger. If the momentum line then begins to follow, then it is an indication that a trade should be made.
- Long Trades: The Stochastic line is above 25 and the momentum line is greater than -25.
- Short Trade: The Stochastic line is below -25 and the momentum line is less than 25.
Whilst an actual alert function is not set for the indicator, the TradingView alert function can be used to trigger a message when either the stochastic line or momentum line crosses -25/25 (the key levels).
I've been using this successfully on the one hour FX charts, but seems to work equally as well on higher or lower time frames (not less than 15min).
The other indicators which are part of the suite are shown on the website which is highlighted in my signature at the bottom of the page. Purchase of the main indicator gives access to the full suite of eight indicators. I use the other indicators to confirm the direction of the trade and to determine if I want to trade or not. I use it along with the 2min, 15min and 4hr timeframes to identify the best entry window and how long I'm likely to be in the trade.
Support can be provided via private message or in the comments below.
The links are provided below for access to the indicator.
릴리즈 노트
An RSI function has been added to the indicator (blue line) which has been converted into a centred (-100 to 100) oscillator. A value of -25 would indicate a potential short trade and a value of +25 would indicate a potential long trade.릴리즈 노트
The indicator has been updated to add in the Inverse Fisher Transformation indicator in the form of a centered oscillator as per the others as part of this indicator. Once again, when the IFT is at >100 this indicates a buy signal and then it indicates <-100 this indicates a sell signal. 초대 전용 스크립트
이 스크립트는 작성자가 승인한 사용자만 접근할 수 있습니다. 사용하려면 요청 후 승인을 받아야 하며, 일반적으로 결제 후에 허가가 부여됩니다. 자세한 내용은 아래 작성자의 안내를 따르거나 Mikeo82에게 직접 문의하세요.
트레이딩뷰는 스크립트의 작동 방식을 충분히 이해하고 작성자를 완전히 신뢰하지 않는 이상, 해당 스크립트에 비용을 지불하거나 사용하는 것을 권장하지 않습니다. 커뮤니티 스크립트에서 무료 오픈소스 대안을 찾아보실 수도 있습니다.
작성자 지시 사항
면책사항
해당 정보와 게시물은 금융, 투자, 트레이딩 또는 기타 유형의 조언이나 권장 사항으로 간주되지 않으며, 트레이딩뷰에서 제공하거나 보증하는 것이 아닙니다. 자세한 내용은 이용 약관을 참조하세요.
초대 전용 스크립트
이 스크립트는 작성자가 승인한 사용자만 접근할 수 있습니다. 사용하려면 요청 후 승인을 받아야 하며, 일반적으로 결제 후에 허가가 부여됩니다. 자세한 내용은 아래 작성자의 안내를 따르거나 Mikeo82에게 직접 문의하세요.
트레이딩뷰는 스크립트의 작동 방식을 충분히 이해하고 작성자를 완전히 신뢰하지 않는 이상, 해당 스크립트에 비용을 지불하거나 사용하는 것을 권장하지 않습니다. 커뮤니티 스크립트에서 무료 오픈소스 대안을 찾아보실 수도 있습니다.
작성자 지시 사항
면책사항
해당 정보와 게시물은 금융, 투자, 트레이딩 또는 기타 유형의 조언이나 권장 사항으로 간주되지 않으며, 트레이딩뷰에서 제공하거나 보증하는 것이 아닙니다. 자세한 내용은 이용 약관을 참조하세요.