OPEN-SOURCE SCRIPT
Liquidity Spectrum Visualizer BigBeluga - optimized by nguyenthl
This optimized version of the original Liquidity Spectrum Visualizer is designed for traders who want the same analytical output as the original indicator, but with significantly faster execution and smoother performance.
The script preserves the original visualization and logic — it still maps volume activity across price bins to highlight liquidity clusters — but the internal calculations have been carefully restructured to reduce computational load and improve responsiveness on live charts.
What’s new and why it matters
Single-pass binning algorithm: Each bar is processed once, reducing loop complexity from O(N×M) to O(N). This allows the indicator to run fluidly on higher timeframes and large datasets.
Precomputed min/max levels: Eliminates redundant array scans, improving efficiency for real-time analysis.
Minimal label usage: Only key high/low markers are drawn, removing visual clutter and improving chart readability.
Optimized resource handling: Boxes and lines are refreshed as a group, minimizing redraw lag.
Why this is useful
This version is particularly helpful for traders using complex layouts, slower machines, or multi-chart setups. It offers the same analytical insight into liquidity zones while keeping chart performance stable and responsive.
How to use it
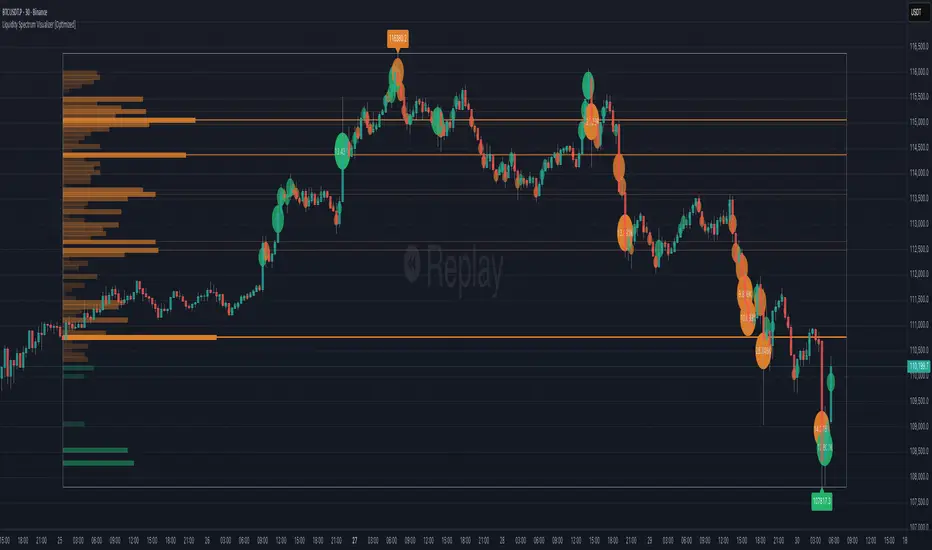
Apply the indicator as you would the original version. It visualizes liquidity distributions, helping identify areas of concentrated activity or potential support/resistance zones.
The script includes optional features such as gradient rendering and POC (Point of Control) highlighting, which can be toggled on or off for clarity.
Notes
The purpose of this version is purely performance optimization — analytical integrity is fully preserved.
The chart example provided focuses solely on this indicator, with no additional overlays, so users can clearly see its visual output.
The script preserves the original visualization and logic — it still maps volume activity across price bins to highlight liquidity clusters — but the internal calculations have been carefully restructured to reduce computational load and improve responsiveness on live charts.
What’s new and why it matters
Single-pass binning algorithm: Each bar is processed once, reducing loop complexity from O(N×M) to O(N). This allows the indicator to run fluidly on higher timeframes and large datasets.
Precomputed min/max levels: Eliminates redundant array scans, improving efficiency for real-time analysis.
Minimal label usage: Only key high/low markers are drawn, removing visual clutter and improving chart readability.
Optimized resource handling: Boxes and lines are refreshed as a group, minimizing redraw lag.
Why this is useful
This version is particularly helpful for traders using complex layouts, slower machines, or multi-chart setups. It offers the same analytical insight into liquidity zones while keeping chart performance stable and responsive.
How to use it
Apply the indicator as you would the original version. It visualizes liquidity distributions, helping identify areas of concentrated activity or potential support/resistance zones.
The script includes optional features such as gradient rendering and POC (Point of Control) highlighting, which can be toggled on or off for clarity.
Notes
The purpose of this version is purely performance optimization — analytical integrity is fully preserved.
The chart example provided focuses solely on this indicator, with no additional overlays, so users can clearly see its visual output.
오픈 소스 스크립트
진정한 트레이딩뷰 정신에 따라 이 스크립트 작성자는 트레이더가 기능을 검토하고 검증할 수 있도록 오픈소스로 공개했습니다. 작성자에게 찬사를 보냅니다! 무료로 사용할 수 있지만 코드를 다시 게시할 경우 하우스 룰이 적용된다는 점을 기억하세요.
Contact me in PM or on Telegram: @nguyenthl
면책사항
이 정보와 게시물은 TradingView에서 제공하거나 보증하는 금융, 투자, 거래 또는 기타 유형의 조언이나 권고 사항을 의미하거나 구성하지 않습니다. 자세한 내용은 이용 약관을 참고하세요.