OPEN-SOURCE SCRIPT
업데이트됨 Volume Balance Indicator Stealthy7
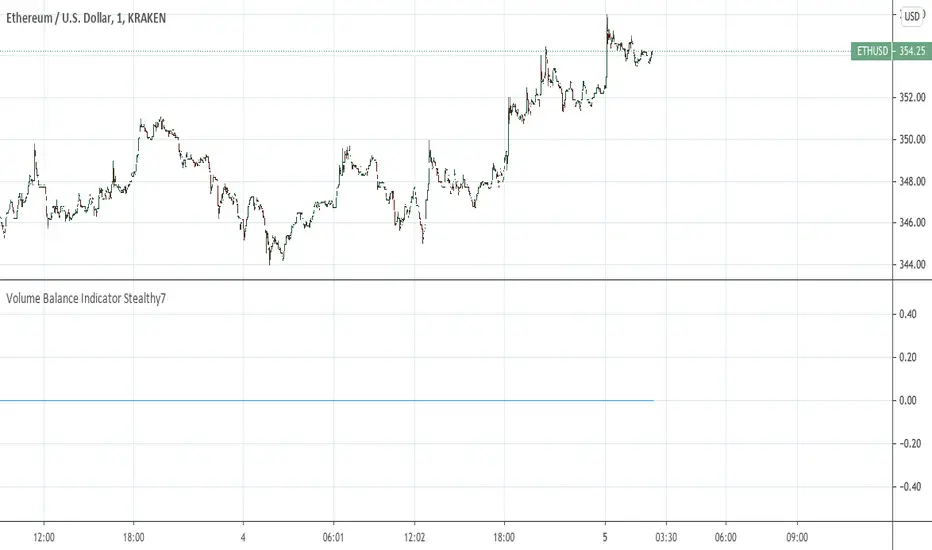
Find out if Bulls (buys) or Bears (sells) are moving the price. This gives a clear view of activity, even if you are using a higher time period. The lookback is in minutes, I believe. This is a superior volume indicator. Bars are recolored to show the underlying activity per the look back (minutes).
릴리즈 노트
In this version I fixed the average volume (grey background). If volume eclipses the grey area, its above average by 30 periods.릴리즈 노트
Automatic lookback.Bar re-color option.
Wow! Really shows whats going on.
릴리즈 노트
I got rid of the old way displayed. This is much more useful and looks totally different.I added Standard deviation bands. Now you know if the volume is really on.
I used a hard coded lookback of 30 because its supposed to be significant (?)
Now you can really see a summary of the underlying minute to minute activity on higher bands.
릴리즈 노트
I added a resolution dropdown box and a lookback period. I think this is closer to my original idea. You can view longer periods on a small timeframe. I think you can do vice versa like I originally intended. Not sure, but this is likely final update for this one. I realize now this is like an On Balance Volume indicator with some extras. I think this version is more useful.릴리즈 노트
Changed some unnecessary code and default settings.릴리즈 노트
Script depreciated. No support.오픈 소스 스크립트
트레이딩뷰의 진정한 정신에 따라, 이 스크립트의 작성자는 이를 오픈소스로 공개하여 트레이더들이 기능을 검토하고 검증할 수 있도록 했습니다. 작성자에게 찬사를 보냅니다! 이 코드는 무료로 사용할 수 있지만, 코드를 재게시하는 경우 하우스 룰이 적용된다는 점을 기억하세요.
면책사항
해당 정보와 게시물은 금융, 투자, 트레이딩 또는 기타 유형의 조언이나 권장 사항으로 간주되지 않으며, 트레이딩뷰에서 제공하거나 보증하는 것이 아닙니다. 자세한 내용은 이용 약관을 참조하세요.
오픈 소스 스크립트
트레이딩뷰의 진정한 정신에 따라, 이 스크립트의 작성자는 이를 오픈소스로 공개하여 트레이더들이 기능을 검토하고 검증할 수 있도록 했습니다. 작성자에게 찬사를 보냅니다! 이 코드는 무료로 사용할 수 있지만, 코드를 재게시하는 경우 하우스 룰이 적용된다는 점을 기억하세요.
면책사항
해당 정보와 게시물은 금융, 투자, 트레이딩 또는 기타 유형의 조언이나 권장 사항으로 간주되지 않으며, 트레이딩뷰에서 제공하거나 보증하는 것이 아닙니다. 자세한 내용은 이용 약관을 참조하세요.