OPEN-SOURCE SCRIPT
Trend Dominance Multi Timeframe [Misu]
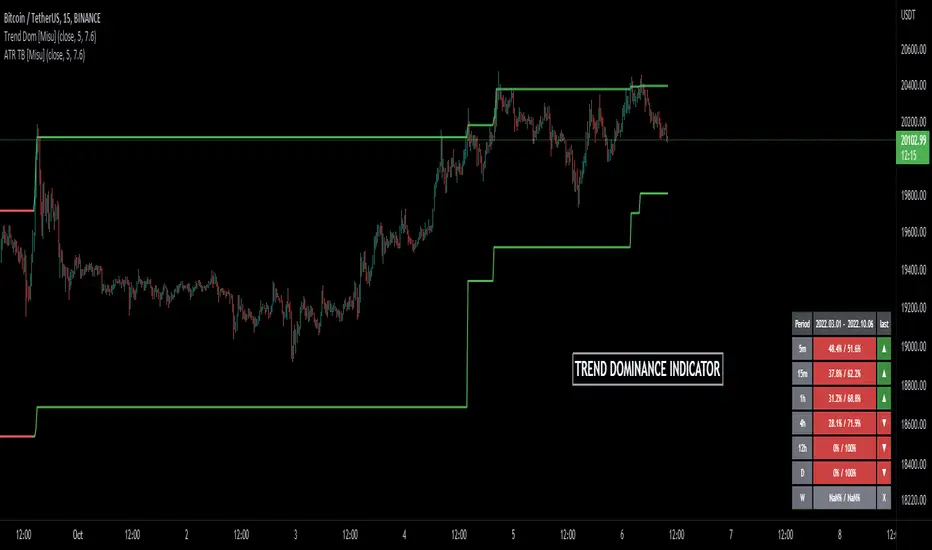
█ This indicator shows the repartition of bullish and bearish trends over a certain period in multiple timeframes. It's also showing the trending direction at the time.
█ Usages:
Trend dominance is expressed with two percentages: left is downtrend and right is uptrend. Cell colors turn green if dominance is up and red if it is down.

Knowing the trend dominance allows you to have a better overview of the market conditions.
You can use it to your advantage to favor long or short trades, reversal or breakout strategies, etc.
█ Features:
> Table colors
> Instant Trend Multitimeframe
> Trend Dominance Multitimeframe
█ Parameters:
> Length: Length is used to calculate ATR.
> Atr Multiplier: A factor used to balance the impact of the ATR on the Trend Bands calculation.
> UI Settings
█ Usages:
Trend dominance is expressed with two percentages: left is downtrend and right is uptrend. Cell colors turn green if dominance is up and red if it is down.
Knowing the trend dominance allows you to have a better overview of the market conditions.
You can use it to your advantage to favor long or short trades, reversal or breakout strategies, etc.
█ Features:
> Table colors
> Instant Trend Multitimeframe
> Trend Dominance Multitimeframe
█ Parameters:
> Length: Length is used to calculate ATR.
> Atr Multiplier: A factor used to balance the impact of the ATR on the Trend Bands calculation.
> UI Settings
릴리즈 노트
Change chart.오픈 소스 스크립트
트레이딩뷰의 진정한 정신에 따라, 이 스크립트의 작성자는 이를 오픈소스로 공개하여 트레이더들이 기능을 검토하고 검증할 수 있도록 했습니다. 작성자에게 찬사를 보냅니다! 이 코드는 무료로 사용할 수 있지만, 코드를 재게시하는 경우 하우스 룰이 적용된다는 점을 기억하세요.
면책사항
해당 정보와 게시물은 금융, 투자, 트레이딩 또는 기타 유형의 조언이나 권장 사항으로 간주되지 않으며, 트레이딩뷰에서 제공하거나 보증하는 것이 아닙니다. 자세한 내용은 이용 약관을 참조하세요.
오픈 소스 스크립트
트레이딩뷰의 진정한 정신에 따라, 이 스크립트의 작성자는 이를 오픈소스로 공개하여 트레이더들이 기능을 검토하고 검증할 수 있도록 했습니다. 작성자에게 찬사를 보냅니다! 이 코드는 무료로 사용할 수 있지만, 코드를 재게시하는 경우 하우스 룰이 적용된다는 점을 기억하세요.
면책사항
해당 정보와 게시물은 금융, 투자, 트레이딩 또는 기타 유형의 조언이나 권장 사항으로 간주되지 않으며, 트레이딩뷰에서 제공하거나 보증하는 것이 아닙니다. 자세한 내용은 이용 약관을 참조하세요.