INVITE-ONLY SCRIPT
Extreme Trend Amplifier (ETA)
Introduction
This indicator was created in V3 Pinescript and all projections will be displayed in real-time for active trading use.
This indicator has been designed so that it can be used across a range of securities such as equities, bonds, FX and cryptocurrencies.
All time-stamps are supported.
Comment and Like to try it out!
Understanding the Extreme Trend Amplifier
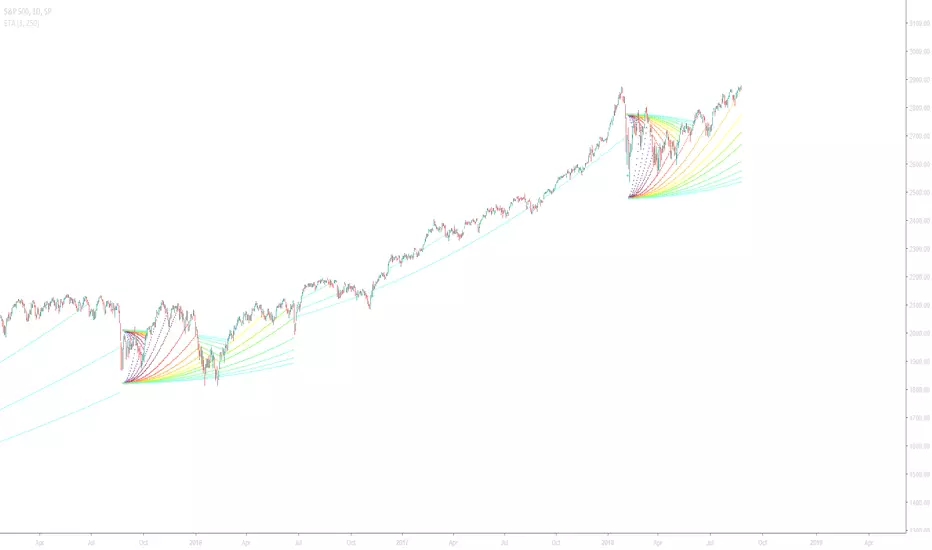
Extreme price changes are often result in a change of trend. This indicator not only allows you to identify the breakout, but to follow the direction of the change. Below is an example of the indicator using normal input values and the Dark TradingView Theme.

The Extreme Trend Amplifier is an indicator that measures the rate of change within a bar of the time stamp and plots a function when the user-defined threshold has been breached. The plot projects parabolic lines that squeeze towards the market price at an ever-increasing rate. The acceleration can also be defined in the indicator settings panel.
Indicator Utility
The first example below is the forex pair, AUD/USD using a rate threshold of 1% and an acceleration factor of three and the second using a rate threshold of 0.8% and an acceleration factor of nine.

We can observe that an increased rate threshold results in fewer instances and that a higher acceleration factor results in the instance projecting farther.
Notice that the acceleration factor is inversely related.
Input Values
Select the “Format”, button located next to the indicator label to adjust the input values and the style.
Rate of change (ROC) is the percentage rise/fall of the security within the time stamp. If ROC is set to 1, this is directly proportionate to 1%.
Securities such as cryptocurrencies are very volatile and will require an increased threshold.
Forex pairs will require a reduced threshold in order to produce an output as volatility is far less.
The line color, thickness and style can also be personalised to customise the strategy even further.

In this example, I have adjusted the projected instance that appears below the bars blue and above the bars red, indicating an uptrend or downtrend.
It is also possible to change specific bars in order to identify the extent to which a trend has continued as seen below.

If you would to find out more about this indicator, visit kenzing.com
This indicator was created in V3 Pinescript and all projections will be displayed in real-time for active trading use.
This indicator has been designed so that it can be used across a range of securities such as equities, bonds, FX and cryptocurrencies.
All time-stamps are supported.
Comment and Like to try it out!
Understanding the Extreme Trend Amplifier
Extreme price changes are often result in a change of trend. This indicator not only allows you to identify the breakout, but to follow the direction of the change. Below is an example of the indicator using normal input values and the Dark TradingView Theme.
The Extreme Trend Amplifier is an indicator that measures the rate of change within a bar of the time stamp and plots a function when the user-defined threshold has been breached. The plot projects parabolic lines that squeeze towards the market price at an ever-increasing rate. The acceleration can also be defined in the indicator settings panel.
Indicator Utility
The first example below is the forex pair, AUD/USD using a rate threshold of 1% and an acceleration factor of three and the second using a rate threshold of 0.8% and an acceleration factor of nine.
We can observe that an increased rate threshold results in fewer instances and that a higher acceleration factor results in the instance projecting farther.
Notice that the acceleration factor is inversely related.
Input Values
Select the “Format”, button located next to the indicator label to adjust the input values and the style.
Rate of change (ROC) is the percentage rise/fall of the security within the time stamp. If ROC is set to 1, this is directly proportionate to 1%.
Securities such as cryptocurrencies are very volatile and will require an increased threshold.
Forex pairs will require a reduced threshold in order to produce an output as volatility is far less.
The line color, thickness and style can also be personalised to customise the strategy even further.
In this example, I have adjusted the projected instance that appears below the bars blue and above the bars red, indicating an uptrend or downtrend.
It is also possible to change specific bars in order to identify the extent to which a trend has continued as seen below.
If you would to find out more about this indicator, visit kenzing.com
초대 전용 스크립트
이 스크립트는 작성자가 승인한 사용자만 접근할 수 있습니다. 사용하려면 요청 후 승인을 받아야 하며, 일반적으로 결제 후에 허가가 부여됩니다. 자세한 내용은 아래 작성자의 안내를 따르거나 GrantPeace에게 직접 문의하세요.
트레이딩뷰는 스크립트의 작동 방식을 충분히 이해하고 작성자를 완전히 신뢰하지 않는 이상, 해당 스크립트에 비용을 지불하거나 사용하는 것을 권장하지 않습니다. 커뮤니티 스크립트에서 무료 오픈소스 대안을 찾아보실 수도 있습니다.
작성자 지시 사항
Kenzing trading indicators for TradingView perform advanced real-time analysis of stock price trends and display alerts that are easy for the average Trader to interpret.
kenzing.com
kenzing.com
면책사항
해당 정보와 게시물은 금융, 투자, 트레이딩 또는 기타 유형의 조언이나 권장 사항으로 간주되지 않으며, 트레이딩뷰에서 제공하거나 보증하는 것이 아닙니다. 자세한 내용은 이용 약관을 참조하세요.