INVITE-ONLY SCRIPT
업데이트됨 Nifty's Indicator
This Indicator is only for Indian market and works only on 'Nifty' and 'Banknifty'. Please don't use it in any other stock/indices.
Use it in only in 3m and 1m timeframe. No other timeframe is to be used.
This indicator gives only sell signals on intraday basis.
When you apply this indicator on charts then you will see 2 things ploted there.
1. Barcolor
2. Background color
Barcolor :
We have use unique trend analysing tool in this indicator, which identifies price is in Uptrend or Downtrend. If price is in uptrend
then candle color will become GREEN and it will remain green until price comes in downtrend. In downtrend candle color becomes RED.
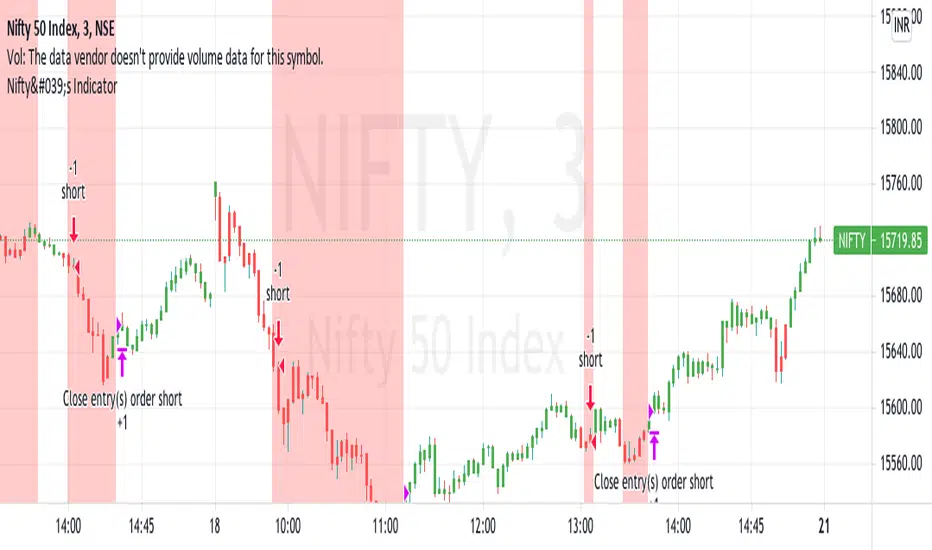
Background color :
We have observed that price behaves a certain way when it is in downtrend. So we try to catch that behaviour of Nifty and Banknifty .
And when ever we observe that behaviour, a red color background is formed in background. This red color background indicates user that
price may fall now.
HOW TO USE :
ENTRY => You should trade only on 3m timeframe. When you see a RED COLOR candle inside RED ZONE then take a SELL trade. That means red background
is indicating that price may fall and red color bar also indicating the same. And your entry should be in between 09:15-10:30 and 12:30-14:55.
This is the time slot when price is volatile.
EXIT => You exit when red zone ends or the trading day ends.
BACKTESTING :
Based on these entry and exit conditions , we have backtested this strategy ( taking only 1 share when sell signal comes ). You can see down arrow on
chart when sell signals comes and uparrow when we exit from trade.
Use it in only in 3m and 1m timeframe. No other timeframe is to be used.
This indicator gives only sell signals on intraday basis.
When you apply this indicator on charts then you will see 2 things ploted there.
1. Barcolor
2. Background color
Barcolor :
We have use unique trend analysing tool in this indicator, which identifies price is in Uptrend or Downtrend. If price is in uptrend
then candle color will become GREEN and it will remain green until price comes in downtrend. In downtrend candle color becomes RED.
Background color :
We have observed that price behaves a certain way when it is in downtrend. So we try to catch that behaviour of Nifty and Banknifty .
And when ever we observe that behaviour, a red color background is formed in background. This red color background indicates user that
price may fall now.
HOW TO USE :
ENTRY => You should trade only on 3m timeframe. When you see a RED COLOR candle inside RED ZONE then take a SELL trade. That means red background
is indicating that price may fall and red color bar also indicating the same. And your entry should be in between 09:15-10:30 and 12:30-14:55.
This is the time slot when price is volatile.
EXIT => You exit when red zone ends or the trading day ends.
BACKTESTING :
Based on these entry and exit conditions , we have backtested this strategy ( taking only 1 share when sell signal comes ). You can see down arrow on
chart when sell signals comes and uparrow when we exit from trade.
릴리즈 노트
This Indicator is only for Indian market and works only on 'Nifty' and 'Banknifty'. Please don't use it in any other stock/indices.Use it in only in 3m and 1m timeframe. No other timeframe is to be used.
This indicator gives only sell signals on intraday basis.
When you apply this indicator on charts then you will see 2 things ploted there.
1. Barcolor
2. Background color
Barcolor :
We have use unique trend analysing tool in this indicator, which identifies price is in Uptrend or Downtrend. If price is in uptrend
then candle color will become GREEN and it will remain green until price comes in downtrend. In downtrend candle color becomes RED.
Background color :
We have observed that price behaves a certain way when it is in downtrend. So we try to catch that behaviour of Nifty and Banknifty .
And when ever we observe that behaviour, a red color background is formed in background. This red color background indicates user that
price may fall now.
HOW TO USE :
ENTRY => You should trade only on 3m timeframe. When you see a RED COLOR candle inside RED ZONE then take a SELL trade. That means red background
is indicating that price may fall and red color bar also indicating the same. And your entry should be in between 09:15-10:30 and 12:30-14:55.
This is the time slot when price is volatile.
EXIT => You exit when red zone ends or the trading day ends.
BACKTESTING :
Based on these entry and exit conditions , we have backtested this strategy ( taking only 1 share when sell signal comes ). You can see down arrow on
chart when sell signals comes and uparrow when we exit from trade.
초대 전용 스크립트
이 스크립트는 작성자가 승인한 사용자만 접근할 수 있습니다. 사용하려면 요청 후 승인을 받아야 하며, 일반적으로 결제 후에 허가가 부여됩니다. 자세한 내용은 아래 작성자의 안내를 따르거나 KapoorChandra에게 직접 문의하세요.
트레이딩뷰는 스크립트의 작동 방식을 충분히 이해하고 작성자를 완전히 신뢰하지 않는 이상, 해당 스크립트에 비용을 지불하거나 사용하는 것을 권장하지 않습니다. 커뮤니티 스크립트에서 무료 오픈소스 대안을 찾아보실 수도 있습니다.
작성자 지시 사항
If needed access then contact me. Whatsapp 9911706040 or kapoorballu8@gmail.com
Kapoor Chandra
+9911706040
IIT-Delhi
+9911706040
IIT-Delhi
면책사항
해당 정보와 게시물은 금융, 투자, 트레이딩 또는 기타 유형의 조언이나 권장 사항으로 간주되지 않으며, 트레이딩뷰에서 제공하거나 보증하는 것이 아닙니다. 자세한 내용은 이용 약관을 참조하세요.