INVITE-ONLY SCRIPT
Deribit Options

█ OVERVIEW
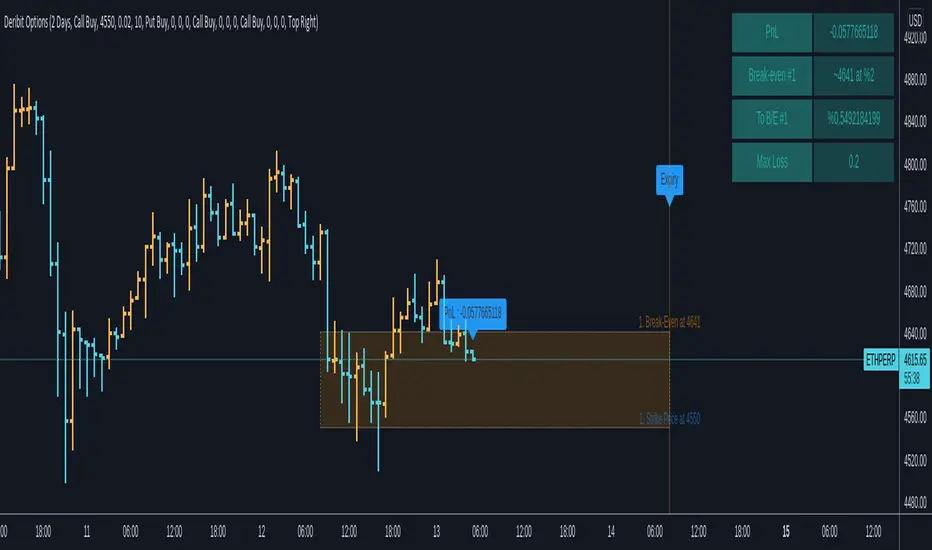
This script is designed to plot some essential option parameters in the chart, such as the expiry, your Break-even point and the strike price. Having these plotted on the chart can make your trading journey much more easier. It's always better to visualize the data/points on the chart than have it only as a foggy picture on your head. This script will also show tell the the distance from the current price to your Break-even, and the distance from Strike Price to break-even. All simple and easy to do on a piece of paper, but that for sure could take some time to plot correctly on the chart. The script will also show you an on-time PnL.
█ Future Plans and upgrades to this script may include :
1. Graphic chart to represent your PnL at every level.
2. Additional extra parameters
█ How to use :
1. Open the settings.
2. Select the period, then input your option details and you'll see it on the chart.
3. Activate the information box, to see some extra details.
Disclaimer : This script may contain errors as this is the first version. I would recommend double checking the results on a different tool before starting a trade.
초대 전용 스크립트
이 스크립트는 작성자가 승인한 사용자만 접근할 수 있습니다. 사용하려면 요청 후 승인을 받아야 하며, 일반적으로 결제 후에 허가가 부여됩니다. 자세한 내용은 아래 작성자의 안내를 따르거나 NasserHumood에게 직접 문의하세요.
트레이딩뷰는 스크립트의 작동 방식을 충분히 이해하고 작성자를 완전히 신뢰하지 않는 이상, 해당 스크립트에 비용을 지불하거나 사용하는 것을 권장하지 않습니다. 커뮤니티 스크립트에서 무료 오픈소스 대안을 찾아보실 수도 있습니다.
작성자 지시 사항
Feel Free to contact me if you need access to this script, my information is down below.
면책사항
해당 정보와 게시물은 금융, 투자, 트레이딩 또는 기타 유형의 조언이나 권장 사항으로 간주되지 않으며, 트레이딩뷰에서 제공하거나 보증하는 것이 아닙니다. 자세한 내용은 이용 약관을 참조하세요.