OPEN-SOURCE SCRIPT
NSDT MA High-Low
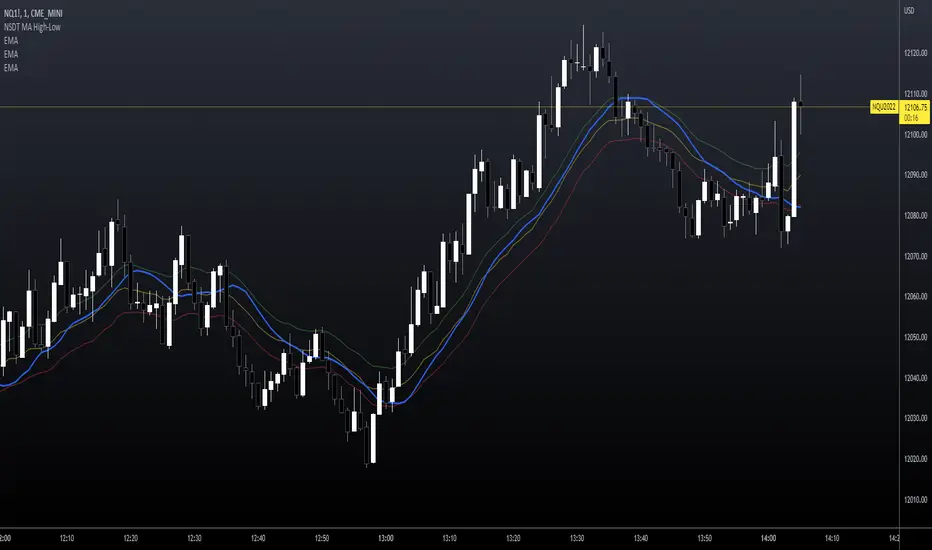
This may seem like a pretty basic Moving Average indicator but I haven't seen one that changes the calculation point depending if the market is going up or down.
I've added three EMA's (length of 20) on this sample chart to demonstrate the differences. These are not included with the indicator.
Green, EMA calculated on High
Red, EMA calculated on Low
Yellow, EMA calculated on Close (default)
Blue, EMA calculated on HIGH when rising but on LOW when falling. (looks at 3 candles back to gauge direction)
* * * Note you can choose between 5 different Moving Average types
Notice how the Blue line (when going up it's calculated on the High) is catching up to the Green line (which is already calculated on the High)?
Notice how the Blue line (when going down so it's calculated on the Low) is catching up to the Red line (which is already calculated on the Low)?
This gives a faster response in the direction of the market because it switches between calculating on the High or Low based on market direction.
This script is free and open source.
오픈 소스 스크립트
트레이딩뷰의 진정한 정신에 따라, 이 스크립트의 작성자는 이를 오픈소스로 공개하여 트레이더들이 기능을 검토하고 검증할 수 있도록 했습니다. 작성자에게 찬사를 보냅니다! 이 코드는 무료로 사용할 수 있지만, 코드를 재게시하는 경우 하우스 룰이 적용된다는 점을 기억하세요.
ALL indicators, strategies and bots are included with Discord access.
NorthStarDayTrading.com/discord
youtube.com/shorts/fWFQE7uEHvU
NorthStarDayTrading.com/discord
youtube.com/shorts/fWFQE7uEHvU
면책사항
해당 정보와 게시물은 금융, 투자, 트레이딩 또는 기타 유형의 조언이나 권장 사항으로 간주되지 않으며, 트레이딩뷰에서 제공하거나 보증하는 것이 아닙니다. 자세한 내용은 이용 약관을 참조하세요.