OPEN-SOURCE SCRIPT
업데이트됨 Intraday Background Time Ranges
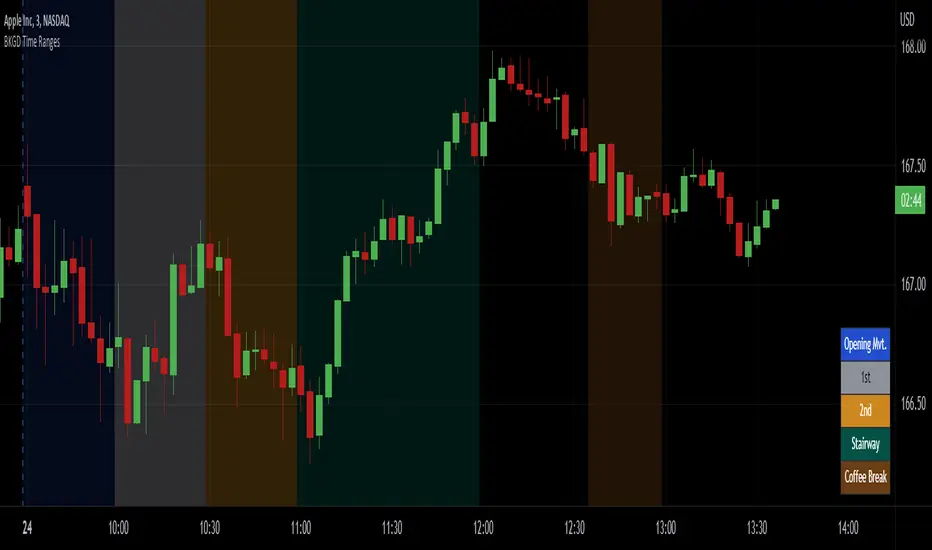
This simple script was written for studying recurring intraday behaviours of financial instruments. With it, you can highlight up to 13 customizable time ranges on your chart, filling the corresponding background space with colors you prefer. You can then write a note for each range and it will be shown in the optional related table.
The experience shows that every financial instrument has its own personality. With this in mind, the script can be useful to study intraday charts with the purpose of discovering recurring behaviours of specific instruments over a certain time range and under specific circumstances (normal days, earnings days, days with catalysts, etc.) This can help the trader to deeply understand the instrument personality, and therefore also to decide whether to enter or exit the market if its behaviour meets or not his expectations.
Please note that this script only works on minute/hourly charts.
릴리즈 노트
Minor fix: Now the table won't appear without any text.Cleaned the code.
릴리즈 노트
Update:1) Shortened the short title, which now is "Time Ranges".
2) Removed the seconds time frame limitation.
3) Cleaned, simplified and improved the overall appearance of the code.
릴리즈 노트
UPDATE:Added 17 additional time ranges, bringing the total to 30.
릴리즈 노트
UPDATE:This new version includes the option to choose whether to project the colors ahead of time, allowing you to see them even before the price reaches the specified time.
In order to achieve this purpose, I had to modify the input mode for the time ranges.
릴리즈 노트
MINOR UPDATE- Fixed the code that displayed the table frame when the time range was selected even in the absence of text.
- Converted the code to v6.
릴리즈 노트
MAJOR UPDATE- Added a new option that lets you choose how the indicator handles time zones:
· Exchange: Time ranges follow the time zone of the current symbol.
· Custom: Select a fixed time zone from a dropdown list to apply across any chart.
Let me know if your time zone is missing, so it can be added in the next update or once at least three requests are collected.
NOTE: If the chart is set to a time zone different from the exchange's, make sure time ranges start after the market opens in the chart’s time zone. Otherwise, they won’t be displayed.
- Time ranges can now be shown on selected weekdays only. The table updates accordingly.
- Improved the way time ranges are shown in advance, eliminating visual flickering.
- Refined the menu layout and made time range inputs more user-friendly.
- Cleaned up the code.
릴리즈 노트
Errata corrige:If the chart is set to a time zone different from the exchange's, make sure time ranges end after the market opens in the chart's time zone. Ranges that start before the open will be partially visible if they end after the open.
Explanation:
For example, if the indicator is set with a custom time zone like "Australia/Sydney" on a US stock chart with extended hours enabled, 4 a.m. EST (the start of pre-market) corresponds to 6:00 p.m. in Sydney. Therefore, you need to set a range that starts at 18:00, or at least ends at 18:01 — in the latter case, only one minute of background will be colored.
릴리즈 노트
MAJOR FIXFixed the "Anticipate" parameter not working as expected.
릴리즈 노트
UPDATEAdded the "Anticipate (Table)" option, which allows displaying all notes or only the one active during the current time range.
릴리즈 노트
Reduced the number of slots by half to improve the indicator's initial loading performance. You can simply add another instance if you need more slots.오픈 소스 스크립트
트레이딩뷰의 진정한 정신에 따라, 이 스크립트의 작성자는 이를 오픈소스로 공개하여 트레이더들이 기능을 검토하고 검증할 수 있도록 했습니다. 작성자에게 찬사를 보냅니다! 이 코드는 무료로 사용할 수 있지만, 코드를 재게시하는 경우 하우스 룰이 적용된다는 점을 기억하세요.
면책사항
해당 정보와 게시물은 금융, 투자, 트레이딩 또는 기타 유형의 조언이나 권장 사항으로 간주되지 않으며, 트레이딩뷰에서 제공하거나 보증하는 것이 아닙니다. 자세한 내용은 이용 약관을 참조하세요.
오픈 소스 스크립트
트레이딩뷰의 진정한 정신에 따라, 이 스크립트의 작성자는 이를 오픈소스로 공개하여 트레이더들이 기능을 검토하고 검증할 수 있도록 했습니다. 작성자에게 찬사를 보냅니다! 이 코드는 무료로 사용할 수 있지만, 코드를 재게시하는 경우 하우스 룰이 적용된다는 점을 기억하세요.
면책사항
해당 정보와 게시물은 금융, 투자, 트레이딩 또는 기타 유형의 조언이나 권장 사항으로 간주되지 않으며, 트레이딩뷰에서 제공하거나 보증하는 것이 아닙니다. 자세한 내용은 이용 약관을 참조하세요.