PROTECTED SOURCE SCRIPT
업데이트됨 Relative Volume with Hull ma and Donchian channel
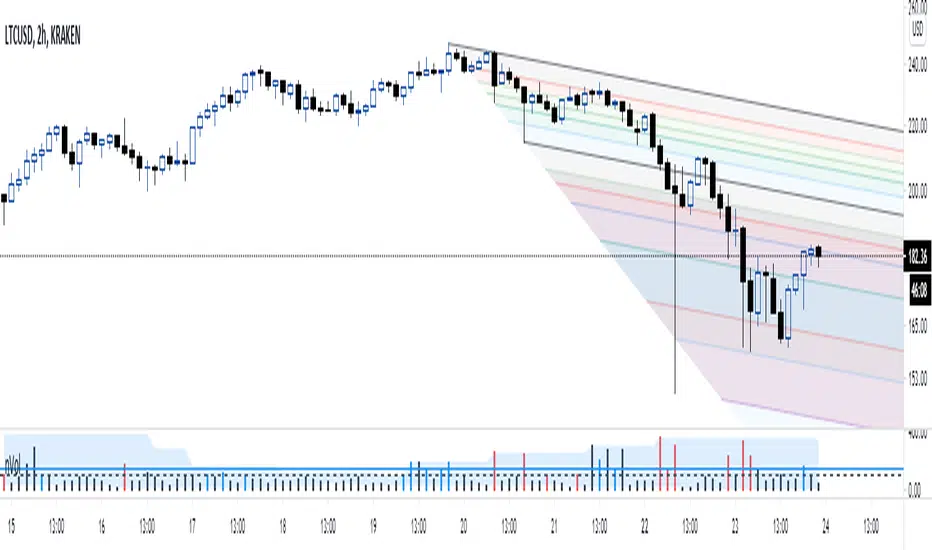
A trader introduced the relative volume to me; I like the concept but its presentation doesn't fit my "visual" taste.
What I did was to color the relative volume bar based on the relationship among (1) hull moving average of the close (2) close vs. open and (3) the relative volume bar reading.
Red -> bearish price action with a lot of volume
Green -> bullish price action with a lot volume
Black -> no clear relationship between volume and price action.
I also added a Donchian channel to the relative volume to further gauge the strength of the relative volume.
All of my posts are for entertainment only.
릴리즈 노트
The purpose of this "relative volume" indicator is to easily visualize whether the volume flow supports with a price-action.To further enhance the visualization, I just shifted the main horizontal line using this code.
nVol = volume / Volume_Average * 100 -100
보호된 스크립트입니다
이 스크립트는 비공개 소스로 게시됩니다. 하지만 이를 자유롭게 제한 없이 사용할 수 있습니다 – 자세한 내용은 여기에서 확인하세요.
면책사항
해당 정보와 게시물은 금융, 투자, 트레이딩 또는 기타 유형의 조언이나 권장 사항으로 간주되지 않으며, 트레이딩뷰에서 제공하거나 보증하는 것이 아닙니다. 자세한 내용은 이용 약관을 참조하세요.
보호된 스크립트입니다
이 스크립트는 비공개 소스로 게시됩니다. 하지만 이를 자유롭게 제한 없이 사용할 수 있습니다 – 자세한 내용은 여기에서 확인하세요.
면책사항
해당 정보와 게시물은 금융, 투자, 트레이딩 또는 기타 유형의 조언이나 권장 사항으로 간주되지 않으며, 트레이딩뷰에서 제공하거나 보증하는 것이 아닙니다. 자세한 내용은 이용 약관을 참조하세요.