OPEN-SOURCE SCRIPT
업데이트됨 Candle Color Overlay

Description:
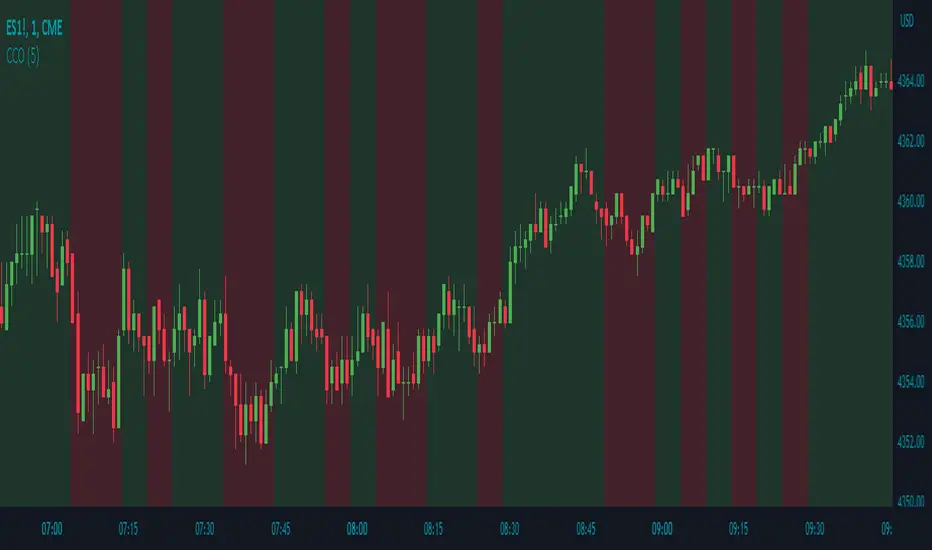
The Candle Color Overlay (CCO) indicator is a powerful tool for visualizing price movements on a chart. It overlays the chart with customizable colors, highlighting bullish and bearish candles based on their open and close values. This indicator helps traders quickly identify the direction of price movements and assess market sentiment.
How it Works:
The Candle Color Overlay indicator performs the following steps:
1. Calculation of the OHLC (Open, High, Low, Close) values for each candle based on the selected timeframe.
2. Classification of each candle as bullish or bearish:
- A bullish candle is when the closing price is greater than or equal to the opening price.
- A bearish candle is when the closing price is lower than the opening price.
3. Overlaying colors on the chart:
- The indicator applies a bullish color to the background when candles are classified as bullish and a bearish color to the background when candles classified as bearish. This overlay provides a visual representation of price movements.
4. Optional display of price movement labels:
- If enabled, the indicator shows a text label at the bottom of the current candle, indicating the percentage increase or decrease in price during a bullish or bearish background period.
Usage:
To effectively use the Candle Color Overlay indicator, follow these steps:
1. Add the indicator to your chart from the list of available indicators.
2. Configure the indicator's inputs:
- Choose the desired color for bullish candles using the "Bullish Color" input.
- Select the preferred color for bearish candles using the "Bearish Color" input.
- Specify the timeframe for analysis using the "Time Frame" input (default is 1 hour).
- Optionally enable the "Show Background Price Movement" input to display the percentage increase or decrease in price during each background period.
3. Analyze the colored overlay:
- Bullish colors represent candles where the closing price is greater than or equal to the opening price, indicating bullish sentiment.
- Bearish colors represent candles where the closing price is lower than the opening price, indicating bearish sentiment.
4. If enabled, observe the price movement labels
5. Combine the insights from the colored overlay and the price movement labels with other technical analysis tools, such as trend lines, support and resistance levels, or candlestick patterns, to make well-informed trading decisions.
릴리즈 노트
Pine Coders Required Changes릴리즈 노트
- The default timeframe has been adjusted to 5 minutes- The default background candle color transparency has been set to 20%
오픈 소스 스크립트
트레이딩뷰의 진정한 정신에 따라, 이 스크립트의 작성자는 이를 오픈소스로 공개하여 트레이더들이 기능을 검토하고 검증할 수 있도록 했습니다. 작성자에게 찬사를 보냅니다! 이 코드는 무료로 사용할 수 있지만, 코드를 재게시하는 경우 하우스 룰이 적용된다는 점을 기억하세요.
면책사항
해당 정보와 게시물은 금융, 투자, 트레이딩 또는 기타 유형의 조언이나 권장 사항으로 간주되지 않으며, 트레이딩뷰에서 제공하거나 보증하는 것이 아닙니다. 자세한 내용은 이용 약관을 참조하세요.
오픈 소스 스크립트
트레이딩뷰의 진정한 정신에 따라, 이 스크립트의 작성자는 이를 오픈소스로 공개하여 트레이더들이 기능을 검토하고 검증할 수 있도록 했습니다. 작성자에게 찬사를 보냅니다! 이 코드는 무료로 사용할 수 있지만, 코드를 재게시하는 경우 하우스 룰이 적용된다는 점을 기억하세요.
면책사항
해당 정보와 게시물은 금융, 투자, 트레이딩 또는 기타 유형의 조언이나 권장 사항으로 간주되지 않으며, 트레이딩뷰에서 제공하거나 보증하는 것이 아닙니다. 자세한 내용은 이용 약관을 참조하세요.