INVITE-ONLY SCRIPT
Smoothed Candles
It is a graphical indicator used to identify trends and pullbacks. Through it, it is possible to eliminate the noises and clearly see the smoothed pattern.
How should I use it ? This is just a example to be used with this indicator.
Let's assume that we are looking for sell opportunities.

 AUDUSD
The example can be better described in the image below:

 EURUSD
Another example os use, displayed in the image below:

 EURJPY
Look how makes it easy to identify tops and bottoms.

 BTCUSD
Very easy to indetify trends:

 GBPUSD
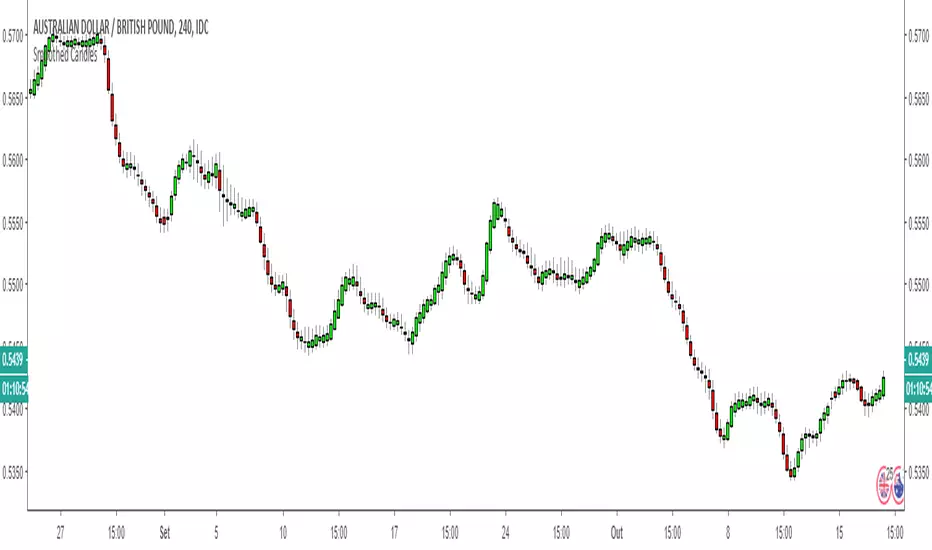
Very easy to indetify pullbacks:

AUDGBP

It can be used with almost of pairs!
If you are interested in purchase, access the link below:
2450ca2f.ngrok.io/home
How should I use it ? This is just a example to be used with this indicator.
Let's assume that we are looking for sell opportunities.
- step 1: identify some (at least 3) positives (green) candles with a good volume, excluding consolidation regions.
- step 2: wait for negative (red) candles with a good volume and also all previous candles must be by majority green.
- step 3: wait for pullback with high volume or consolidation region to close the position.
The example can be better described in the image below:
Another example os use, displayed in the image below:
Look how makes it easy to identify tops and bottoms.
Very easy to indetify trends:
Very easy to indetify pullbacks:
It can be used with almost of pairs!
If you are interested in purchase, access the link below:
2450ca2f.ngrok.io/home
초대 전용 스크립트
이 스크립트는 작성자가 승인한 사용자만 접근할 수 있습니다. 사용하려면 요청 후 승인을 받아야 하며, 일반적으로 결제 후에 허가가 부여됩니다. 자세한 내용은 아래 작성자의 안내를 따르거나 FranciscoBiaso에게 직접 문의하세요.
트레이딩뷰는 스크립트의 작동 방식을 충분히 이해하고 작성자를 완전히 신뢰하지 않는 이상, 해당 스크립트에 비용을 지불하거나 사용하는 것을 권장하지 않습니다. 커뮤니티 스크립트에서 무료 오픈소스 대안을 찾아보실 수도 있습니다.
작성자 지시 사항
면책사항
해당 정보와 게시물은 금융, 투자, 트레이딩 또는 기타 유형의 조언이나 권장 사항으로 간주되지 않으며, 트레이딩뷰에서 제공하거나 보증하는 것이 아닙니다. 자세한 내용은 이용 약관을 참조하세요.