INVITE-ONLY SCRIPT
Volume Delta (Expo)
█ Overview
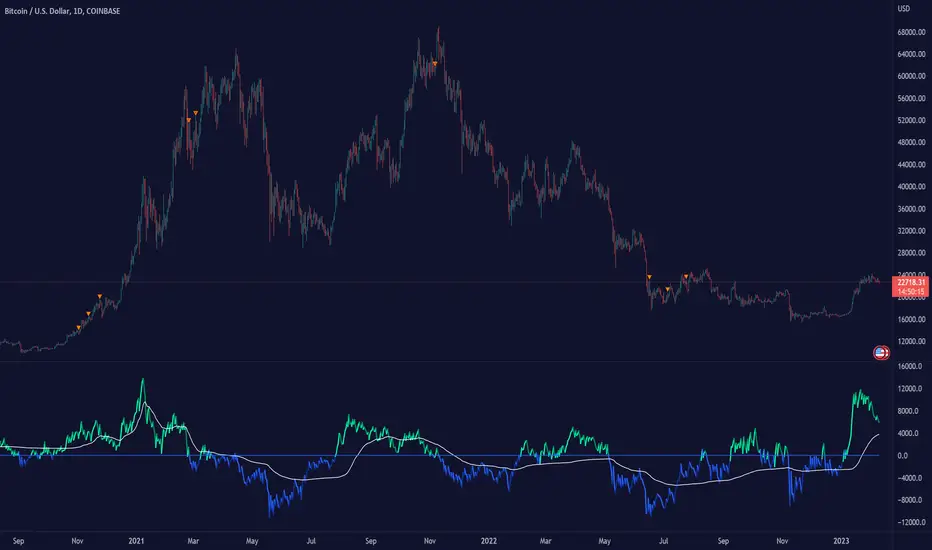
Volume Delta (Expo) is a trading tool that measures the difference between buying and selling volume in a given market. It is a powerful tool for analyzing volume clusters and price action, as it can help traders identify the direction and strength of the trend as well as potential volume-weighted support and resistance areas.
█ How is the Volume Delta calculated?
Volume Delta is calculated by subtracting the number of contracts traded on the bid from the number of contracts traded on the ask. A positive Volume Delta indicates that more contracts are being traded on the ask than on the bid, which suggests buying pressure. A negative Volume Delta indicates that more contracts are being traded on the bid than on the ask, which suggests selling pressure.
█ How to Use Volume Delta to Analyze Volume Clusters
Volume clusters are areas of high volume that indicate a potential change in price direction. Once the clusters have been identified, traders can then use Volume Delta to measure the difference between buying and selling volume in the clusters.
If the buying volume is greater than the selling volume, it indicates that the price is likely to move higher. Conversely, if the selling volume is greater than the buying volume, it indicates that the price is likely to move lower.
In addition to measuring the difference between buying and selling volume, traders can also use Volume Delta to analyze price action. By looking at the volume clusters and the corresponding price action, traders can identify potential support and resistance levels.
█ How to use
The volume delta provides insight into market sentiment, as a rise in buying volume on a positive close indicates that bullish sentiment is strengthening, while a rise in selling volume on a negative close indicates that bearish sentiment is increasing. In addition, use volume delta to identify the direction and strength of the trend.
Volume - divergences
If the volume delta is positive but the price trend is still bearish, it could be an indication that the current trend is weakening and a reversal may be imminent. Similarly, if the volume delta is negative but the price trend is still bullish, it could be an indication that the current trend is weakening and a reversal may be imminent.
█ Indicator Features
In addition to the main Volume Delta feature, the indicator has the following features:
-----------------
Disclaimer
The information contained in my Scripts/Indicators/Ideas/Algos/Systems does not constitute financial advice or a solicitation to buy or sell any securities of any type. I will not accept liability for any loss or damage, including without limitation any loss of profit, which may arise directly or indirectly from the use of or reliance on such information.
All investments involve risk, and the past performance of a security, industry, sector, market, financial product, trading strategy, backtest, or individual's trading does not guarantee future results or returns. Investors are fully responsible for any investment decisions they make. Such decisions should be based solely on an evaluation of their financial circumstances, investment objectives, risk tolerance, and liquidity needs.
My Scripts/Indicators/Ideas/Algos/Systems are only for educational purposes!
Volume Delta (Expo) is a trading tool that measures the difference between buying and selling volume in a given market. It is a powerful tool for analyzing volume clusters and price action, as it can help traders identify the direction and strength of the trend as well as potential volume-weighted support and resistance areas.
█ How is the Volume Delta calculated?
Volume Delta is calculated by subtracting the number of contracts traded on the bid from the number of contracts traded on the ask. A positive Volume Delta indicates that more contracts are being traded on the ask than on the bid, which suggests buying pressure. A negative Volume Delta indicates that more contracts are being traded on the bid than on the ask, which suggests selling pressure.
- Note, our Volume Delta (Expo) uses intrabar analysis in combination with volume clusters which is a great approximation to calculating volume delta on TradingView. The tool is equipped with a unique volume-weighted cluster function to calculate the delta trend over time as well as a dynamic trend strength calculation.
█ How to Use Volume Delta to Analyze Volume Clusters
Volume clusters are areas of high volume that indicate a potential change in price direction. Once the clusters have been identified, traders can then use Volume Delta to measure the difference between buying and selling volume in the clusters.
If the buying volume is greater than the selling volume, it indicates that the price is likely to move higher. Conversely, if the selling volume is greater than the buying volume, it indicates that the price is likely to move lower.
In addition to measuring the difference between buying and selling volume, traders can also use Volume Delta to analyze price action. By looking at the volume clusters and the corresponding price action, traders can identify potential support and resistance levels.
█ How to use
The volume delta provides insight into market sentiment, as a rise in buying volume on a positive close indicates that bullish sentiment is strengthening, while a rise in selling volume on a negative close indicates that bearish sentiment is increasing. In addition, use volume delta to identify the direction and strength of the trend.
- It's common among volume traders to use volume delta to confirm trends, identify reversals, divergences, and volume-weighted support and resistance areas
Volume - divergences
If the volume delta is positive but the price trend is still bearish, it could be an indication that the current trend is weakening and a reversal may be imminent. Similarly, if the volume delta is negative but the price trend is still bullish, it could be an indication that the current trend is weakening and a reversal may be imminent.
█ Indicator Features
In addition to the main Volume Delta feature, the indicator has the following features:
- Adaptive or Stability Volume Strength: Choose between adaptive or stability volume strength.
- Exhausted Volume bars: Show Exhausted Volume Bars on the chart.
- Divergences: Enable Regular and Hidden Volume Divergences
-----------------
Disclaimer
The information contained in my Scripts/Indicators/Ideas/Algos/Systems does not constitute financial advice or a solicitation to buy or sell any securities of any type. I will not accept liability for any loss or damage, including without limitation any loss of profit, which may arise directly or indirectly from the use of or reliance on such information.
All investments involve risk, and the past performance of a security, industry, sector, market, financial product, trading strategy, backtest, or individual's trading does not guarantee future results or returns. Investors are fully responsible for any investment decisions they make. Such decisions should be based solely on an evaluation of their financial circumstances, investment objectives, risk tolerance, and liquidity needs.
My Scripts/Indicators/Ideas/Algos/Systems are only for educational purposes!
초대 전용 스크립트
이 스크립트는 작성자가 승인한 사용자만 접근할 수 있습니다. 사용하려면 요청 후 승인을 받아야 하며, 일반적으로 결제 후에 허가가 부여됩니다. 자세한 내용은 아래 작성자의 안내를 따르거나 Zeiierman에게 직접 문의하세요.
트레이딩뷰는 스크립트의 작동 방식을 충분히 이해하고 작성자를 완전히 신뢰하지 않는 이상, 해당 스크립트에 비용을 지불하거나 사용하는 것을 권장하지 않습니다. 커뮤니티 스크립트에서 무료 오픈소스 대안을 찾아보실 수도 있습니다.
작성자 지시 사항
Get instant access here: https://zeiiermantrading.com
Access my indicators at: zeiierman.com/black-friday-sale
Join Our Free Discord: discord.gg/zeiiermantrading
Join Our Free Discord: discord.gg/zeiiermantrading
면책사항
해당 정보와 게시물은 금융, 투자, 트레이딩 또는 기타 유형의 조언이나 권장 사항으로 간주되지 않으며, 트레이딩뷰에서 제공하거나 보증하는 것이 아닙니다. 자세한 내용은 이용 약관을 참조하세요.