PROTECTED SOURCE SCRIPT
업데이트됨 Conditional Volatility Percentile
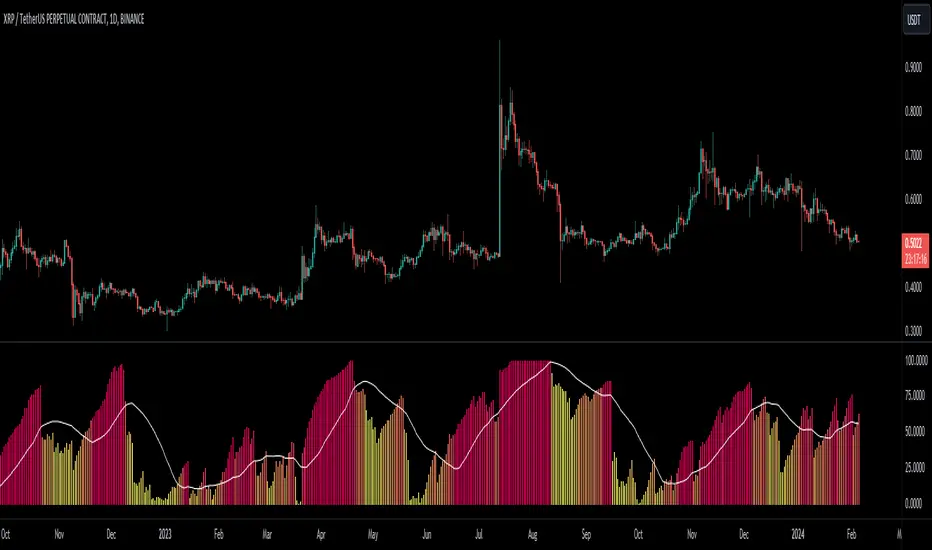
Simple Description: This indicator can basically help you find when a big move might happen (This indicator can't determine the direction but when a big move could happen.) Basically, a low-extreme value like 0 means that it only has room for upside, so volatility can only expand from that point on, and the fact that volatility mean reverts supports this.
Conditional Volatility Percentile Indicator
This indicator is a tool designed to view current market volatility relative to historical levels. It uses a statistical approach to assess the percentile rank of the calculated conditional volatility.
The Volatility Calculation
This indicator calculates conditional variance with user-defined parameters, which are Omega, Alpha, Beta, and Sigma, and then takes the square root of the variance to calculate the standard deviation. The script then calculates the percentile rank of the conditional variance over a specified lookback.
What this indicator tells you:
In financial markets, volatility itself exhibits mean-reverting properties. This means that periods of high volatility are likely to be followed by periods of lower volatility, and vice versa.
1. High Volatility Periods: High volatility levels may be followed by a subsequent decrease in volatility as the market returns to a more typical state.
2. Low Volatility Periods: Periods of low volatility may be followed by an uptick in volatility as the market experiences new information or changes in sentiment.


Conditional Volatility Percentile Indicator
This indicator is a tool designed to view current market volatility relative to historical levels. It uses a statistical approach to assess the percentile rank of the calculated conditional volatility.
The Volatility Calculation
This indicator calculates conditional variance with user-defined parameters, which are Omega, Alpha, Beta, and Sigma, and then takes the square root of the variance to calculate the standard deviation. The script then calculates the percentile rank of the conditional variance over a specified lookback.
What this indicator tells you:
- Volatility Assessment: Higher percentile values indicate heightened conditional volatility, suggesting increased market activity or potential stress. Meanwhile, lower percentiles suggest relatively lower conditional volatility.
- Extreme Values: Volatility is a mean-reverting process. If the volatility percentile value is at a low value for an extended period of time, you can eventually bet on the volatility percentile value increasing with high confidence.
In financial markets, volatility itself exhibits mean-reverting properties. This means that periods of high volatility are likely to be followed by periods of lower volatility, and vice versa.
1. High Volatility Periods: High volatility levels may be followed by a subsequent decrease in volatility as the market returns to a more typical state.
2. Low Volatility Periods: Periods of low volatility may be followed by an uptick in volatility as the market experiences new information or changes in sentiment.
릴리즈 노트
Made the titles more accurate보호된 스크립트입니다
이 스크립트는 비공개 소스로 게시됩니다. 하지만 이를 자유롭게 제한 없이 사용할 수 있습니다 – 자세한 내용은 여기에서 확인하세요.
면책사항
해당 정보와 게시물은 금융, 투자, 트레이딩 또는 기타 유형의 조언이나 권장 사항으로 간주되지 않으며, 트레이딩뷰에서 제공하거나 보증하는 것이 아닙니다. 자세한 내용은 이용 약관을 참조하세요.
보호된 스크립트입니다
이 스크립트는 비공개 소스로 게시됩니다. 하지만 이를 자유롭게 제한 없이 사용할 수 있습니다 – 자세한 내용은 여기에서 확인하세요.
면책사항
해당 정보와 게시물은 금융, 투자, 트레이딩 또는 기타 유형의 조언이나 권장 사항으로 간주되지 않으며, 트레이딩뷰에서 제공하거나 보증하는 것이 아닙니다. 자세한 내용은 이용 약관을 참조하세요.