INVITE-ONLY SCRIPT
The Trending Band Indicator
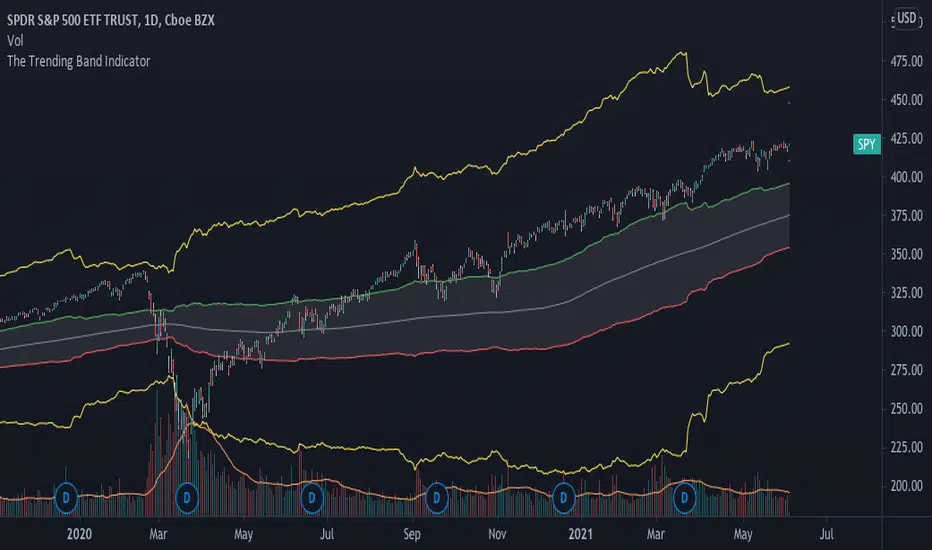
This indicator shows the trend of the market. The middle line is the 200-day moving average because it shows the long term trend of the market. However, since the market does give fake signals of going up and down through the 200-day moving average, I had to put a band on it to push through the fake signals. The first band around the middle line is 1 standard deviation of historical volatility which gives an area of cushion to prevent fake signals. The goal is if the stock is above the first top band, then the stock is in an uptrend. If the stock is below the first bottom band, then the stock is in a downtrend. If it is the middle of the first bands, then the stock is known to be rangebound.
The top most and bottom most yellow lines are 4 standard deviations of historical volatility which give an idea of where the floor and ceiling are. This helps investors and traders identify good buy and sell zones using the yellow lines to see overbought and oversold sides.
This is a great indicator for people who need help following the trend of a stock, etf , etc.
초대 전용 스크립트
이 스크립트는 작성자가 승인한 사용자만 접근할 수 있습니다. 사용하려면 요청을 보내고 승인을 받아야 합니다. 일반적으로 결제 후에 승인이 이루어집니다. 자세한 내용은 아래 작성자의 지침을 따르거나 tenpercentcreditspreads에게 직접 문의하세요.
트레이딩뷰는 스크립트 작성자를 완전히 신뢰하고 스크립트 작동 방식을 이해하지 않는 한 스크립트 비용을 지불하거나 사용하지 않는 것을 권장하지 않습니다. 무료 오픈소스 대체 스크립트는 커뮤니티 스크립트에서 찾을 수 있습니다.
작성자 지시 사항
In order to get access to this indicator, send me a private message on Tradingview, email me at hello@theimpeccableinvestor or DM me on Instagram (@theimpeccableinvestor)
면책사항
이 정보와 게시물은 TradingView에서 제공하거나 보증하는 금융, 투자, 거래 또는 기타 유형의 조언이나 권고 사항을 의미하거나 구성하지 않습니다. 자세한 내용은 이용 약관을 참고하세요.