OPEN-SOURCE SCRIPT
업데이트됨 Accumulation/Distribution Bands & Signals (BTC, 1D, BITSTAMP)

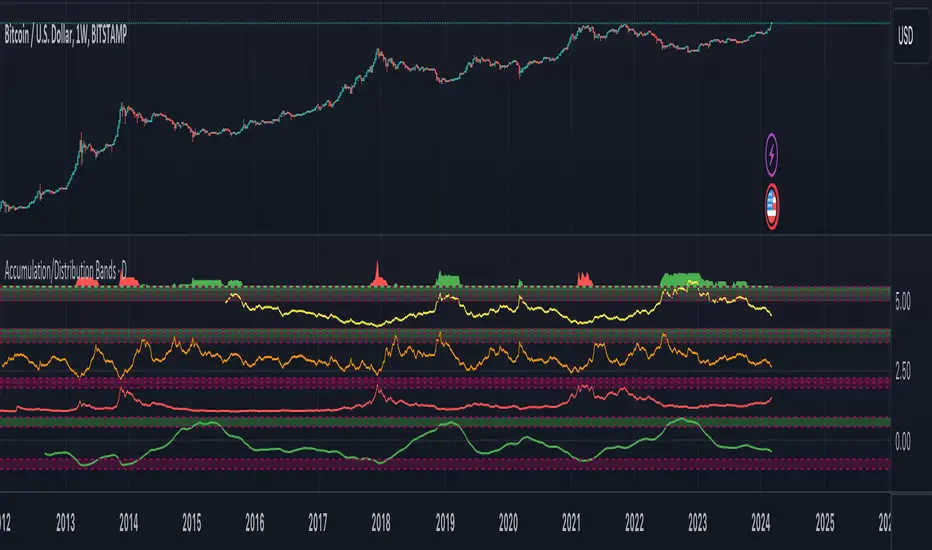
This is an accumulation/distribution indicator for BTC/USD (D) based on variations of 1400D and 120D moving averages and logarithmic regression. Yellow plot signals Long Term Accumulation, which is based on 1400D (200W) ALMA, orange plot signals Mid Term Accumulation and is based on 120D ALMA, and finally the red plot signals Long Term Distribution that's based on log regression. It should be noted that for red plot to work BTC 1D BITSTAMP graph must be used, because the function of the logarithmic regression was modified according to the x axis of the BITSTAMP data.
Signal bands have different coefficients; long term accumulation (yellow) and and the log regression (red) plots have the highest coefficients and mid term accumulation (orange) has the lowest coefficients. Coefficients are 6x, 3x and 1.5x for the red (sell) and yellow (buy) plots and 1x, 2x and 3x for the orange (buy) plot. Selling coefficient for the yellow and the orange plots are respectively 2x and 1x. Buy and sell signals are summed up accordingly and plotted at the top of the highest band.
Acknowledgement: Credits for the logarithmic regression function are due memotyka9009 and Benjamin Cowen
릴리즈 노트
Updated accumulation/distribution bands now also includes a modified pi cycle top indicator which is used for both sell and buy signals. Additionally some parameters were readjusted.Buy or sell a certain percentage (up to you to decide the exact value) of your BTC weekly depending on the intensity of accumulation/distribution signals!
릴리즈 노트
Note: You can use the indicator in any timeframe of 1D, 1W or 1M depending on how frequently you want to accumulate or distribute, the indicator is for long term investments. For mid term investing you can use the Trend Identifier, while shorter term indicators will be published later.릴리즈 노트
Please use 오픈 소스 스크립트
트레이딩뷰의 진정한 정신에 따라, 이 스크립트의 작성자는 이를 오픈소스로 공개하여 트레이더들이 기능을 검토하고 검증할 수 있도록 했습니다. 작성자에게 찬사를 보냅니다! 이 코드는 무료로 사용할 수 있지만, 코드를 재게시하는 경우 하우스 룰이 적용된다는 점을 기억하세요.
면책사항
해당 정보와 게시물은 금융, 투자, 트레이딩 또는 기타 유형의 조언이나 권장 사항으로 간주되지 않으며, 트레이딩뷰에서 제공하거나 보증하는 것이 아닙니다. 자세한 내용은 이용 약관을 참조하세요.
오픈 소스 스크립트
트레이딩뷰의 진정한 정신에 따라, 이 스크립트의 작성자는 이를 오픈소스로 공개하여 트레이더들이 기능을 검토하고 검증할 수 있도록 했습니다. 작성자에게 찬사를 보냅니다! 이 코드는 무료로 사용할 수 있지만, 코드를 재게시하는 경우 하우스 룰이 적용된다는 점을 기억하세요.
면책사항
해당 정보와 게시물은 금융, 투자, 트레이딩 또는 기타 유형의 조언이나 권장 사항으로 간주되지 않으며, 트레이딩뷰에서 제공하거나 보증하는 것이 아닙니다. 자세한 내용은 이용 약관을 참조하세요.