INVITE-ONLY SCRIPT
업데이트됨 [UPRIGHT] Awesome DMI+

Hello Traders,
Today I'm releasing a spin on an 'oldie but goodie'; the Directional Movement Index (DMI).
DMI is a combination of 3 different indicators developed by the famous J. Welles Wilder. DMI has 3 different plots: the ADX, +DI, and -DI. The first is the ADX (Average Directional Index), which Wilder created in 1978 to show the strength of a trend by comparing the current price with the previous price range. The other two are the +DI (positive directional indicator) and the -DI show up as two separate lines, +DI is the difference between the highest price of the current day and the highest price of the day before, and -DI does the same calculation with the current and previous day's lows.
How does it work?
When the ADX line is above 25 (as a general rule, some traders use a different threshold, +/- 5), the trend is strong. When the +DI line is above the -DI line, the asset (stock) is moving in an uptrend, and the opposite means the asset is in a downtrend.
How is this different?
The ribbons created by the fill make it easier to see the change in direction of each plot.

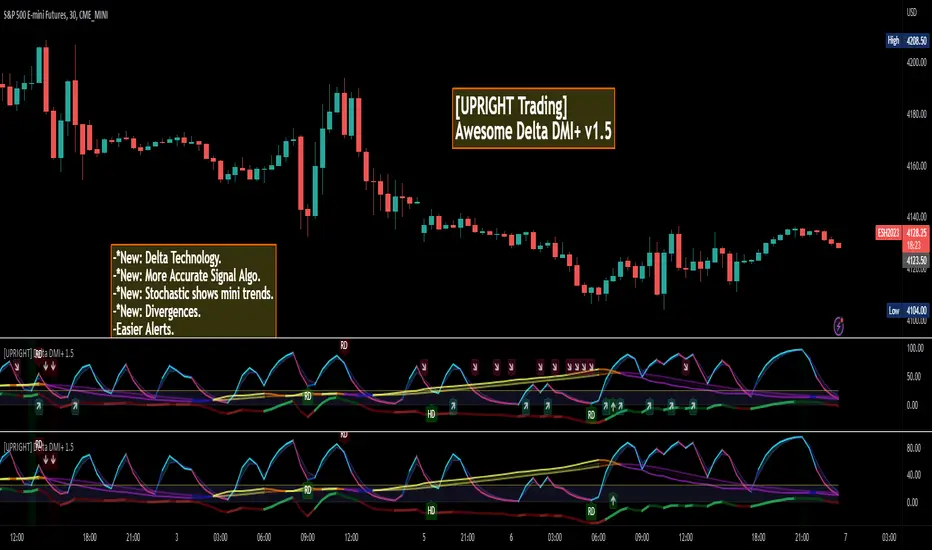
The chart should look like:

Cheers,
Mike
(UPRIGHT TRADING)
Today I'm releasing a spin on an 'oldie but goodie'; the Directional Movement Index (DMI).
DMI is a combination of 3 different indicators developed by the famous J. Welles Wilder. DMI has 3 different plots: the ADX, +DI, and -DI. The first is the ADX (Average Directional Index), which Wilder created in 1978 to show the strength of a trend by comparing the current price with the previous price range. The other two are the +DI (positive directional indicator) and the -DI show up as two separate lines, +DI is the difference between the highest price of the current day and the highest price of the day before, and -DI does the same calculation with the current and previous day's lows.
How does it work?
When the ADX line is above 25 (as a general rule, some traders use a different threshold, +/- 5), the trend is strong. When the +DI line is above the -DI line, the asset (stock) is moving in an uptrend, and the opposite means the asset is in a downtrend.
How is this different?
- Uses multiple calculations to produce signals for an indicator than normally doesn't have any.
- Multiple ADX's, +DI's, and -DI's for better accuracy and clearer direction changes.
- Ability to use 2 different background highlight signals and several buy/sell signals.
- Fully customizable (as always), ability to turn on or off any signals, change any of the colors to suit your needs.
- Added pre-filled Alerts.
The ribbons created by the fill make it easier to see the change in direction of each plot.
The chart should look like:
Cheers,
Mike
(UPRIGHT TRADING)
릴리즈 노트
Delta DMI v1.5 Update:- -*New: Delta Technology.
- -*New: More Accurate Signal Algo.
- -*New: Stochastic shows mini trends.
- -*New: Divergences.
- -Easier Alerts.
- -New layout and look.
- -New color scheme.
릴리즈 노트
--Small bug fixes and tweaks.초대 전용 스크립트
이 스크립트는 작성자가 승인한 사용자만 접근할 수 있습니다. 사용하려면 요청 후 승인을 받아야 하며, 일반적으로 결제 후에 허가가 부여됩니다. 자세한 내용은 아래 작성자의 안내를 따르거나 UPRIGHTTrading에게 직접 문의하세요.
트레이딩뷰는 스크립트의 작동 방식을 충분히 이해하고 작성자를 완전히 신뢰하지 않는 이상, 해당 스크립트에 비용을 지불하거나 사용하는 것을 권장하지 않습니다. 커뮤니티 스크립트에서 무료 오픈소스 대안을 찾아보실 수도 있습니다.
작성자 지시 사항
https://uprighttrades.com to try for free.
Site: uprighttrades.com
Scripts: tradingview.com/u/UPRIGHTTrading/
Like & follow for great ideas, indicators, and to see what I've been working on to my your trading easier for you.
Scripts: tradingview.com/u/UPRIGHTTrading/
Like & follow for great ideas, indicators, and to see what I've been working on to my your trading easier for you.
면책사항
해당 정보와 게시물은 금융, 투자, 트레이딩 또는 기타 유형의 조언이나 권장 사항으로 간주되지 않으며, 트레이딩뷰에서 제공하거나 보증하는 것이 아닙니다. 자세한 내용은 이용 약관을 참조하세요.
초대 전용 스크립트
이 스크립트는 작성자가 승인한 사용자만 접근할 수 있습니다. 사용하려면 요청 후 승인을 받아야 하며, 일반적으로 결제 후에 허가가 부여됩니다. 자세한 내용은 아래 작성자의 안내를 따르거나 UPRIGHTTrading에게 직접 문의하세요.
트레이딩뷰는 스크립트의 작동 방식을 충분히 이해하고 작성자를 완전히 신뢰하지 않는 이상, 해당 스크립트에 비용을 지불하거나 사용하는 것을 권장하지 않습니다. 커뮤니티 스크립트에서 무료 오픈소스 대안을 찾아보실 수도 있습니다.
작성자 지시 사항
https://uprighttrades.com to try for free.
Site: uprighttrades.com
Scripts: tradingview.com/u/UPRIGHTTrading/
Like & follow for great ideas, indicators, and to see what I've been working on to my your trading easier for you.
Scripts: tradingview.com/u/UPRIGHTTrading/
Like & follow for great ideas, indicators, and to see what I've been working on to my your trading easier for you.
면책사항
해당 정보와 게시물은 금융, 투자, 트레이딩 또는 기타 유형의 조언이나 권장 사항으로 간주되지 않으며, 트레이딩뷰에서 제공하거나 보증하는 것이 아닙니다. 자세한 내용은 이용 약관을 참조하세요.