OPEN-SOURCE SCRIPT
업데이트됨 Auto Trend Projection
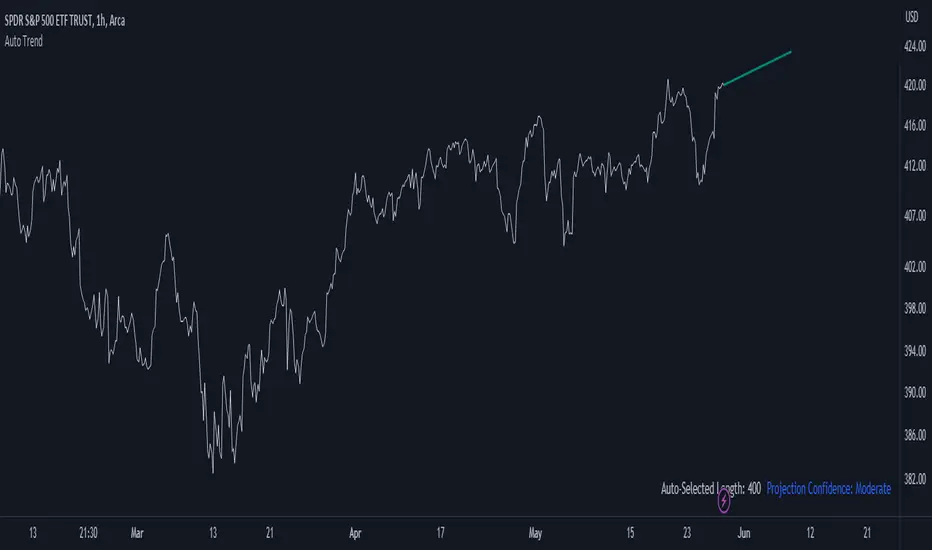
Auto Trend Projection is an indicator designed to automatically project the short-term trend based on historical price data. It utilizes a dynamic calculation method to determine the slope of the linear regression line, which represents the trend direction. The indicator takes into account multiple length inputs and calculates the deviation and Pearson's R values for each length.
Using the highest Pearson's R value, Auto Trend Projection identifies the optimal length for the trend projection. This ensures that the projected trend aligns closely with the historical price data.
The indicator visually displays the projected trend using trendlines. These trendlines extend into the future, providing a visual representation of the potential price movement in the short term. The color and style of the trendlines can be customized according to user preferences.
Auto Trend Projection simplifies the process of trend analysis by automating the projection of short-term trends. Traders and investors can use this indicator to gain insights into potential price movements and make informed trading decisions.
Please note that Auto Trend Projection is not a standalone trading strategy but a tool to assist in trend analysis. It is recommended to combine it with other technical analysis tools and indicators for comprehensive market analysis.
Overall, Auto Trend Projection offers a convenient and automated approach to projecting short-term trends, empowering traders with valuable insights into the potential price direction.
릴리즈 노트
I have added a table to display the Auto-Selected Length and Projection Confidence.오픈 소스 스크립트
트레이딩뷰의 진정한 정신에 따라, 이 스크립트의 작성자는 이를 오픈소스로 공개하여 트레이더들이 기능을 검토하고 검증할 수 있도록 했습니다. 작성자에게 찬사를 보냅니다! 이 코드는 무료로 사용할 수 있지만, 코드를 재게시하는 경우 하우스 룰이 적용된다는 점을 기억하세요.
Plan the trade ⚡ Trade the plan
면책사항
해당 정보와 게시물은 금융, 투자, 트레이딩 또는 기타 유형의 조언이나 권장 사항으로 간주되지 않으며, 트레이딩뷰에서 제공하거나 보증하는 것이 아닙니다. 자세한 내용은 이용 약관을 참조하세요.
오픈 소스 스크립트
트레이딩뷰의 진정한 정신에 따라, 이 스크립트의 작성자는 이를 오픈소스로 공개하여 트레이더들이 기능을 검토하고 검증할 수 있도록 했습니다. 작성자에게 찬사를 보냅니다! 이 코드는 무료로 사용할 수 있지만, 코드를 재게시하는 경우 하우스 룰이 적용된다는 점을 기억하세요.
Plan the trade ⚡ Trade the plan
면책사항
해당 정보와 게시물은 금융, 투자, 트레이딩 또는 기타 유형의 조언이나 권장 사항으로 간주되지 않으며, 트레이딩뷰에서 제공하거나 보증하는 것이 아닙니다. 자세한 내용은 이용 약관을 참조하세요.