OPEN-SOURCE SCRIPT
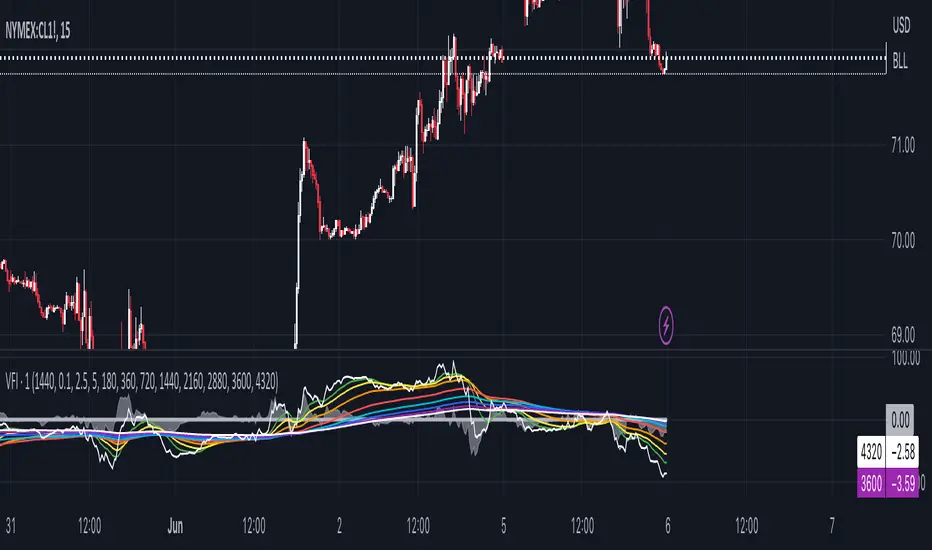
1 min Volume Flow Indicator (VFI) with EMA ribbon
Originally Markos Katsanos' indicator that LazyBear made popular here on TW. Now updated to Pine Script version 5, which makes multi-timeframe charting easier.
The initial Katsanos' idea for the indicator is the following:
"The VFI is based on the popular On Balance Volume (OBV) but with three very important modifications:
Unlike the OBV, indicator values are no longer meaningless. Positive readings are bullish and negative bearish.
The calculation is based on the day’s median instead of the closing price.
A volatility threshold takes into account minimal price changes and another threshold eliminates excessive volume. ...
A simplified interpretation of the VFI is that values above zero indicate a bullish state and the crossing of the zero line is the trigger or buy signal.
The strongest signal with all money flow indicators is of course divergence.
The classic form of divergence is when the indicator refuses to follow the price action and makes lower highs while price makes higher highs (negative divergence). If price reaches a new low but the indicator fails to do so, then price probably traveled lower than it should have. In this instance, you have positive divergence."
I set up default settings for intraday trading I personally have found the most useful. And what I have found useful is how and which volume flows in and out on 1 min chart. For 1 min volume flow I find it convenient to have specific EMAs as guidance: 360, 720, 1440, 2160, 2880, 3600, 4320 -- the logic is derived from how many minutes there are per specific hours and days. Since short term trends typically last for three days, 1440 and 4320 EMAs are the ones I myself concentrate the most. That is to say, quite often 1min volume flow pivots around 1440 and 4320 EMAs.
If you want to see 1 min volume flow on some other timeframe than 1 min, change the timeframe in the settings.
오픈 소스 스크립트
트레이딩뷰의 진정한 정신에 따라, 이 스크립트의 작성자는 이를 오픈소스로 공개하여 트레이더들이 기능을 검토하고 검증할 수 있도록 했습니다. 작성자에게 찬사를 보냅니다! 이 코드는 무료로 사용할 수 있지만, 코드를 재게시하는 경우 하우스 룰이 적용된다는 점을 기억하세요.
면책사항
해당 정보와 게시물은 금융, 투자, 트레이딩 또는 기타 유형의 조언이나 권장 사항으로 간주되지 않으며, 트레이딩뷰에서 제공하거나 보증하는 것이 아닙니다. 자세한 내용은 이용 약관을 참조하세요.
오픈 소스 스크립트
트레이딩뷰의 진정한 정신에 따라, 이 스크립트의 작성자는 이를 오픈소스로 공개하여 트레이더들이 기능을 검토하고 검증할 수 있도록 했습니다. 작성자에게 찬사를 보냅니다! 이 코드는 무료로 사용할 수 있지만, 코드를 재게시하는 경우 하우스 룰이 적용된다는 점을 기억하세요.
면책사항
해당 정보와 게시물은 금융, 투자, 트레이딩 또는 기타 유형의 조언이나 권장 사항으로 간주되지 않으며, 트레이딩뷰에서 제공하거나 보증하는 것이 아닙니다. 자세한 내용은 이용 약관을 참조하세요.