OPEN-SOURCE SCRIPT
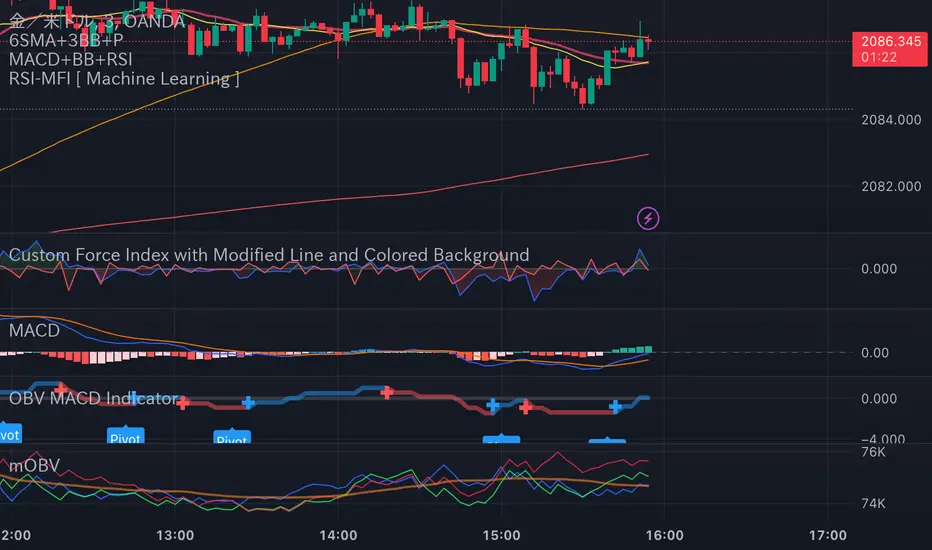
Modified On Balance Volume

Modified On Balance Volume (mOBV) Indicator
The "Modified On Balance Volume" (mOBV) indicator is designed to provide insights into the cumulative buying and selling pressure in the market, with modifications for close, high, and low prices. It incorporates On Balance Volume (OBV) calculations for each of these price types and further refines the analysis by applying Simple Moving Averages (SMA).
Key Features:
Calculation of OBV for Close, High, and Low Prices:
Traditional OBV values are computed for close, high, and low prices, reflecting the cumulative volume based on the sign of price changes.
SMA Smoothing:
Simple Moving Averages (SMA) are applied to the calculated OBV values, introducing a smoothing effect to highlight trends in the buying and selling pressure.
Relative Values for High and Low OBV:
The script transforms the OBV values for high and low prices into relative values compared to the SMA of the OBV for close prices.
User-Defined SMA Length:
Users can customize the length of the SMA through a parameter, allowing flexibility in adapting the indicator to different market conditions.
Error Handling:
The script includes a mechanism to detect if no volume data is provided by the data vendor, alerting users to potential issues with the dataset.
Visual Representation:
The calculated OBV values for close, high, and low prices, as well as the SMA of the OBV for close prices, are visually represented on the chart with customizable colors and transparency settings.
Usage Tips:
Rising values indicate increasing buying pressure, while falling values suggest increasing selling pressure.
Crosses between the OBV lines and the SMA line may be used to identify potential trend changes.
Note:
This script is intended for informational purposes and should be used in conjunction with other technical analysis tools for comprehensive market analysis.
오픈 소스 스크립트
트레이딩뷰의 진정한 정신에 따라, 이 스크립트의 작성자는 이를 오픈소스로 공개하여 트레이더들이 기능을 검토하고 검증할 수 있도록 했습니다. 작성자에게 찬사를 보냅니다! 이 코드는 무료로 사용할 수 있지만, 코드를 재게시하는 경우 하우스 룰이 적용된다는 점을 기억하세요.
면책사항
해당 정보와 게시물은 금융, 투자, 트레이딩 또는 기타 유형의 조언이나 권장 사항으로 간주되지 않으며, 트레이딩뷰에서 제공하거나 보증하는 것이 아닙니다. 자세한 내용은 이용 약관을 참조하세요.
오픈 소스 스크립트
트레이딩뷰의 진정한 정신에 따라, 이 스크립트의 작성자는 이를 오픈소스로 공개하여 트레이더들이 기능을 검토하고 검증할 수 있도록 했습니다. 작성자에게 찬사를 보냅니다! 이 코드는 무료로 사용할 수 있지만, 코드를 재게시하는 경우 하우스 룰이 적용된다는 점을 기억하세요.
면책사항
해당 정보와 게시물은 금융, 투자, 트레이딩 또는 기타 유형의 조언이나 권장 사항으로 간주되지 않으며, 트레이딩뷰에서 제공하거나 보증하는 것이 아닙니다. 자세한 내용은 이용 약관을 참조하세요.