INVITE-ONLY SCRIPT
STS_RSI_MTF
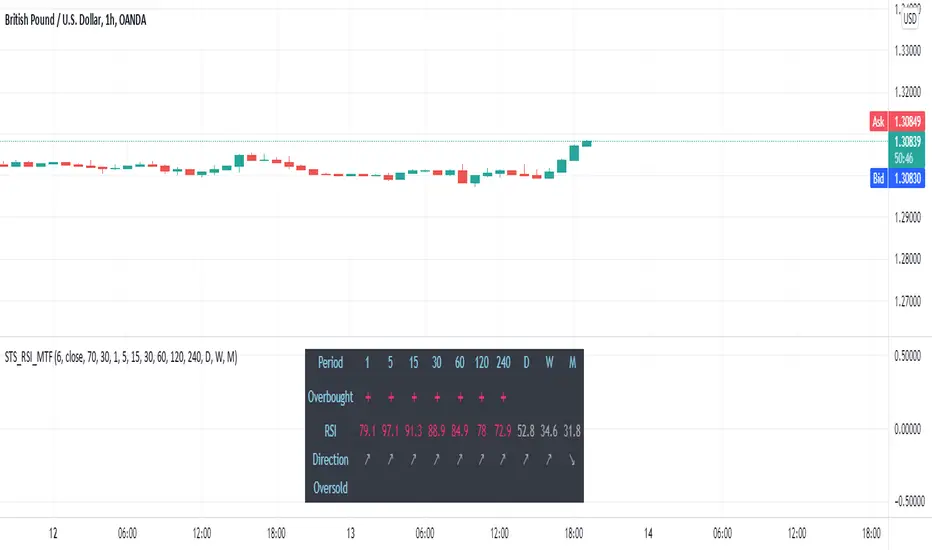
The STS RSI MTF Indicator shows overbought and oversold conditions of the RSI. It follows and displays the RSI values on all timeframes from M1 to MN1 in the lower left corner of your chart.
The RSI options are completely adjustable. You can choose different periods for the RSI. Multiple variants for the RSI applied price can be chosen (e.g. close price, open price, high, low, etc.). Different values can be set for the Up and Down levels of the RSI.
For example, if you set the STS RSI MTF indicator with Up level 70 and Down level 30, it will show in green all values below 30 (oversold), and in red all values above 70 (overbought).
초대 전용 스크립트
이 스크립트는 작성자가 승인한 사용자만 접근할 수 있습니다. 사용하려면 요청 후 승인을 받아야 하며, 일반적으로 결제 후에 허가가 부여됩니다. 자세한 내용은 아래 작성자의 안내를 따르거나 SmartTradingSoftware에게 직접 문의하세요.
트레이딩뷰는 스크립트의 작동 방식을 충분히 이해하고 작성자를 완전히 신뢰하지 않는 이상, 해당 스크립트에 비용을 지불하거나 사용하는 것을 권장하지 않습니다. 커뮤니티 스크립트에서 무료 오픈소스 대안을 찾아보실 수도 있습니다.
작성자 지시 사항
Visit us at https://smarttradingsoftware.com
Contact us at office@smarttradingsoftware.com
면책사항
해당 정보와 게시물은 금융, 투자, 트레이딩 또는 기타 유형의 조언이나 권장 사항으로 간주되지 않으며, 트레이딩뷰에서 제공하거나 보증하는 것이 아닙니다. 자세한 내용은 이용 약관을 참조하세요.