INVITE-ONLY SCRIPT
Chart Killer B
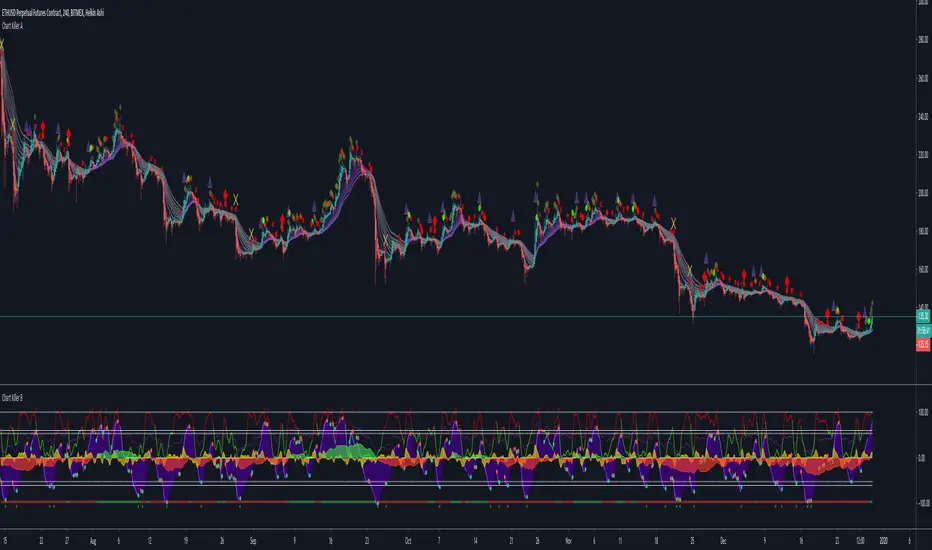
Chart Killer B combines five well known algorithms (VWAP, MFI, RSI, Stoch, Wave Trend)
Primary Triggers:
Green Dots – Leading buy signals that excel in sideways and upward trends.
Red Dots – Leading sell signals that excel in sideways and downward trends.
Purple Waves – You are looking for overbought and oversold readings for the most part here, but to get the most out of these waves, learn how to spot divergent price action which often foreshadows a future price move.
Yellow VWAP – We have incorporated the VWAP into an oscillator. It is the easiest algorithm on B to read. When it crosses up, you are long until the next cross down. When it crosses down, you are short until the next cross up.
Secondary Triggers:
MFI – The custom Money Flow oscillator gives a great visual of market conditions. When it is green, we say the grass is growing, the Bulls are grazing, and the strategy is to buy dips. When the MFI is red, buyers are dead, and the prevailing strategy is to short the peaks. You can filter many bad trades by paying attention to the MFI.
RSI – The RSI misses many opportunities on its own, but when used in tandem the other oscillators in B, can provide an extra layer of confidence via overbought and oversold readings.
초대 전용 스크립트
이 스크립트는 작성자가 승인한 사용자만 접근할 수 있습니다. 사용하려면 요청 후 승인을 받아야 하며, 일반적으로 결제 후에 허가가 부여됩니다. 자세한 내용은 아래 작성자의 안내를 따르거나 FlipThatLot에게 직접 문의하세요.
트레이딩뷰는 스크립트의 작동 방식을 충분히 이해하고 작성자를 완전히 신뢰하지 않는 이상, 해당 스크립트에 비용을 지불하거나 사용하는 것을 권장하지 않습니다. 커뮤니티 스크립트에서 무료 오픈소스 대안을 찾아보실 수도 있습니다.
작성자 지시 사항
We're not the guru. We're the facilitator.
면책사항
해당 정보와 게시물은 금융, 투자, 트레이딩 또는 기타 유형의 조언이나 권장 사항으로 간주되지 않으며, 트레이딩뷰에서 제공하거나 보증하는 것이 아닙니다. 자세한 내용은 이용 약관을 참조하세요.