OPEN-SOURCE SCRIPT
업데이트됨 Fixed Quantum CDV

We took the original script Cumulative delta volume from LonesomeTheBlue, here is the link: 
To understand the CDV you can watch traders reality master class about CDV.
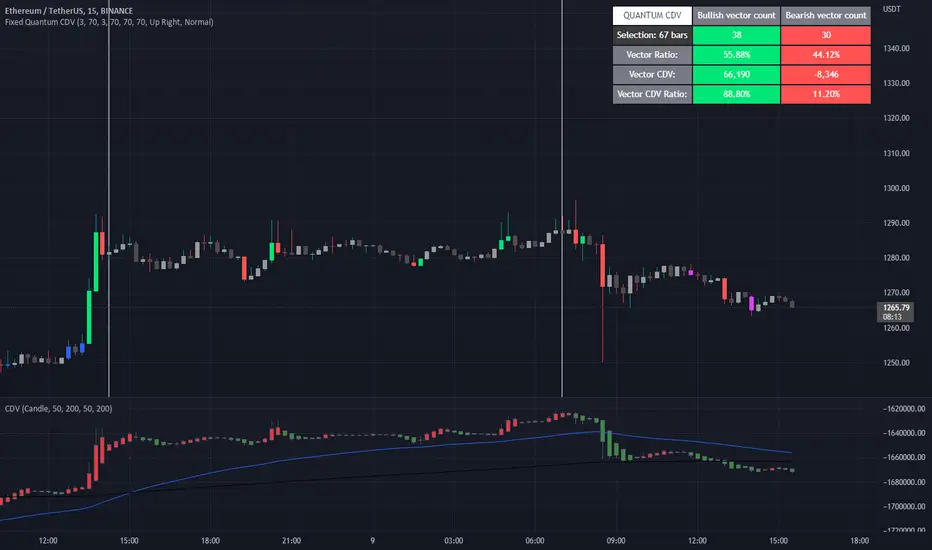
This indicator show the ratio of vector color and the ratio of the cumulative delta volume from vector color.
First you select a date range on the chart. Then it calculate all candles in that region. Let's say there is 3 green vectors and 3 red vectors in the region, the ratio of vector color will be 50% for bull and 50% for bear vector. As for the CDV ratio, it will measure the total CDV inside green vector and total CDV inside red vector and make a ratio. But it is a little different.
I twisted the calculation for the ratio of CDV a little bit to make it more comprehensive in the table. Since it's the ratio of the CDV for the bull candles versus the bear candles, the CDV is almost always a positive number for the bull candles and almost always a negative number for the bear candle. So I calculated the bear CDV as a positive number. Formula: Bull_CDV_ratio = Bull_CDV / (Bull_CDV + Bear_CDV), Bear_CDV_ratio = -Bear_CDV / (Bull_CDV - Bear_CDV).
Note that when the bull CDV and bear CDV are both a positive number or both a negative number, the ratio percentage can be over 100% and under 0%. It means that we expect volatility.
Enjoy!
릴리즈 노트
I fixed the line at which you select the time. It was shifted by 1 candle.I changed the alert message for bullish volume to bullish CDV.
릴리즈 노트
Added use low volume vector as default오픈 소스 스크립트
트레이딩뷰의 진정한 정신에 따라, 이 스크립트의 작성자는 이를 오픈소스로 공개하여 트레이더들이 기능을 검토하고 검증할 수 있도록 했습니다. 작성자에게 찬사를 보냅니다! 이 코드는 무료로 사용할 수 있지만, 코드를 재게시하는 경우 하우스 룰이 적용된다는 점을 기억하세요.
면책사항
해당 정보와 게시물은 금융, 투자, 트레이딩 또는 기타 유형의 조언이나 권장 사항으로 간주되지 않으며, 트레이딩뷰에서 제공하거나 보증하는 것이 아닙니다. 자세한 내용은 이용 약관을 참조하세요.
오픈 소스 스크립트
트레이딩뷰의 진정한 정신에 따라, 이 스크립트의 작성자는 이를 오픈소스로 공개하여 트레이더들이 기능을 검토하고 검증할 수 있도록 했습니다. 작성자에게 찬사를 보냅니다! 이 코드는 무료로 사용할 수 있지만, 코드를 재게시하는 경우 하우스 룰이 적용된다는 점을 기억하세요.
면책사항
해당 정보와 게시물은 금융, 투자, 트레이딩 또는 기타 유형의 조언이나 권장 사항으로 간주되지 않으며, 트레이딩뷰에서 제공하거나 보증하는 것이 아닙니다. 자세한 내용은 이용 약관을 참조하세요.