INVITE-ONLY SCRIPT
업데이트됨 Ethereum: Confidence Bands

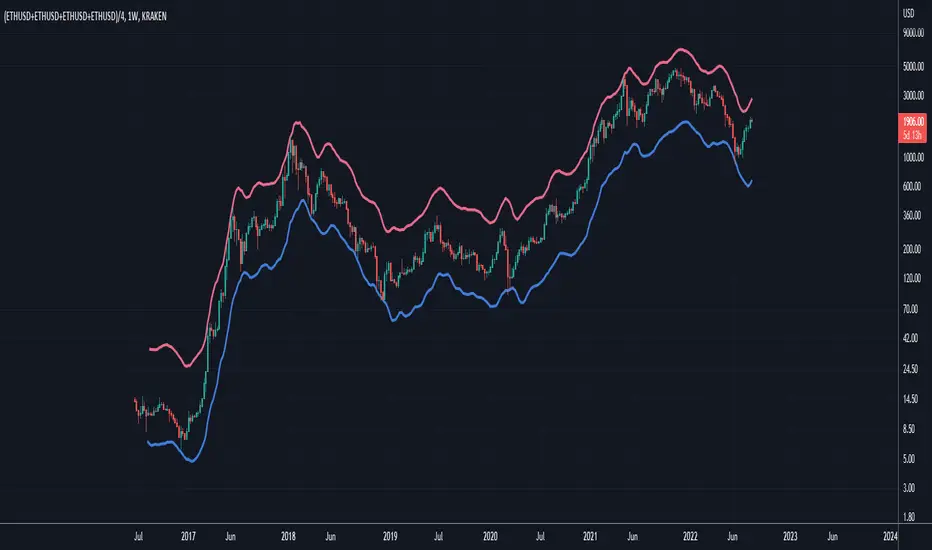
Purpose of this Script
Similar to "Bitcoin: Confidence Bands", this script is designed to show regions of positive and negative overextension for Ethereum, where price is expected to either reverse long-term or at least shorter-term, using custom price loops tuned for the Ethereum case. Again, the idea is that one can be highly confident that Ethereum's price stays within the Confidence Bands, especially when looking at weekly closes. It might be wise to reduce exposure to Ethereum when price gets very near to the red band, and vice versa for an approach of the blue band. Of course this constitutes no financial advice, and one should always consider all available information for making trading decisions.
Settings
This indicator should only be used:
- with the default inputs (but of course feel free to play around a bit for testing purposes)
- on the weekly (W) time frame
- and for the following ticker setup, used to get well averaged Ethereum price data (ideally just copy this and paste it into the ticker field in the upper left area of the chart interface): (KRAKEN:ETHUSD+COINBASE:ETHUSD+BITFINEX:ETHUSD+POLONIEX:ETHUSD)/4
Otherwise the intended functionality cannot be guaranteed.
Access
For access please contact me via DM on TradingView or on Twitter (linked on my TradingView profile and in my signature).
릴리즈 노트
Added Accumulation Bands that can be used during the cycle accumulation phase to identify regions of over- and underextension. The acumulation phase is here defined as starting from the absolute cycle bottom and ending at the next Bitcoin halving. Outside this defined market phase the accumulation bands get increasingly inefficient as stronger impulses and crashes occur during bullmarket and bearmarket respectively, leading to frequent breaches of those bands. For bull- and bearmarkets the classic Confidence Bands should be used.The image below shows the two hitherto existing accumulation phases for Ethereum marked with blue semi-transparent boxes, and the corresponding price touches of the yellow and cyan Accumulation Bands. Note that in the second accumulation phase the March 2020 black swan liquidity crisis happened, which led to a breach of the lower Accumulation Band down to the lower Confidence Band.
https://www.tradingview.com/x/pZyR4hyS/
Note that the Accumulation Bands are hidden from the chart by default when you apply the indicator to your chart, but can be activated in the Input Settings menu.
릴리즈 노트
Added the Resolution parameter, which should always be kept on weekly time frame in the Input Settings menu. With this, the Confidence Bands can correctly be observed on the daily (and other) time frames.릴리즈 노트
Due to data feed problems with Poloniex exchange, it is now recommended to use the ETHEREUM ALL TIME HISTORY INDEX *or* (KRAKEN:ETHUSD+COINBASE:ETHUSD+BITFINEX:ETHUSD+BITSTAMP:ETHUSD)/4 as the ticker.릴리즈 노트
Code update to Pinescript v6.릴리즈 노트
Minor code fix.초대 전용 스크립트
이 스크립트는 작성자가 승인한 사용자만 접근할 수 있습니다. 사용하려면 요청 후 승인을 받아야 하며, 일반적으로 결제 후에 허가가 부여됩니다. 자세한 내용은 아래 작성자의 안내를 따르거나 Dean_Trader에게 직접 문의하세요.
트레이딩뷰는 스크립트의 작동 방식을 충분히 이해하고 작성자를 완전히 신뢰하지 않는 이상, 해당 스크립트에 비용을 지불하거나 사용하는 것을 권장하지 않습니다. 커뮤니티 스크립트에서 무료 오픈소스 대안을 찾아보실 수도 있습니다.
작성자 지시 사항
DM me for further information.
면책사항
해당 정보와 게시물은 금융, 투자, 트레이딩 또는 기타 유형의 조언이나 권장 사항으로 간주되지 않으며, 트레이딩뷰에서 제공하거나 보증하는 것이 아닙니다. 자세한 내용은 이용 약관을 참조하세요.
초대 전용 스크립트
이 스크립트는 작성자가 승인한 사용자만 접근할 수 있습니다. 사용하려면 요청 후 승인을 받아야 하며, 일반적으로 결제 후에 허가가 부여됩니다. 자세한 내용은 아래 작성자의 안내를 따르거나 Dean_Trader에게 직접 문의하세요.
트레이딩뷰는 스크립트의 작동 방식을 충분히 이해하고 작성자를 완전히 신뢰하지 않는 이상, 해당 스크립트에 비용을 지불하거나 사용하는 것을 권장하지 않습니다. 커뮤니티 스크립트에서 무료 오픈소스 대안을 찾아보실 수도 있습니다.
작성자 지시 사항
DM me for further information.
면책사항
해당 정보와 게시물은 금융, 투자, 트레이딩 또는 기타 유형의 조언이나 권장 사항으로 간주되지 않으며, 트레이딩뷰에서 제공하거나 보증하는 것이 아닙니다. 자세한 내용은 이용 약관을 참조하세요.