INVITE-ONLY SCRIPT
업데이트됨 Volume and Trend reversal scalping script
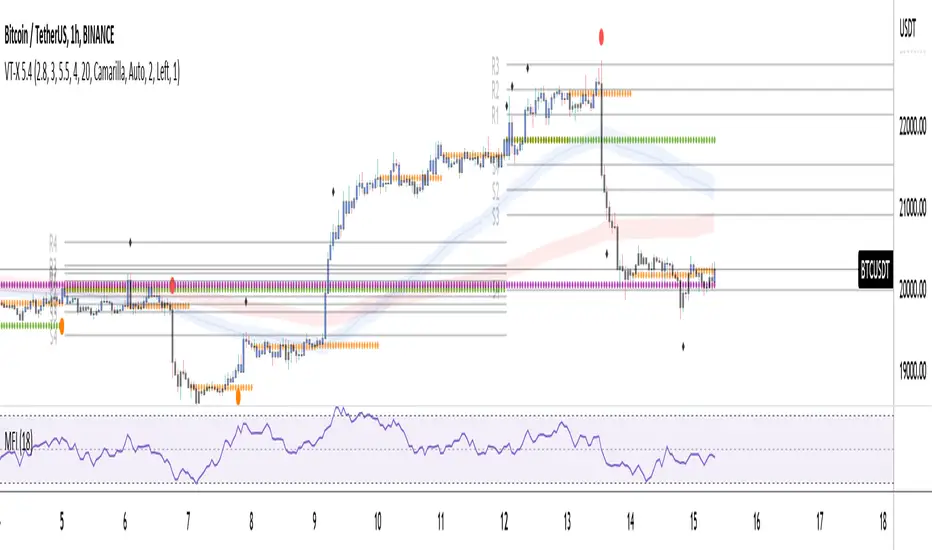
The Vtrend X script allows for both trend based and scalping trading entries, it gives you all the trend and reversal information at hand that is necessary. It works best in a trending market.
The fundamental part of the script, is the volume weighted bands in blue and red, which help determine the trend and dynamic support and resistance . The blue band is a shorter length than the red band.
When the blue band dips below the red band, this tells us there is a downtrend. And when the blue band is trending above the red band, this is bullish uptrend price action. You will be able to note price whatever the timeframe really respects these bands, and you can use that to your advantage flicking through the high and low timeframes on where price will go next, combined with your own support and resistance levels.

Combined with the candle colors, which change whether they close above or below the main trend colored line (shown below), help identify a change in price action and trend. This allows for low timeframe plays also.

The uptrend and downtrend cicle signals are shown in a few different colors. Green and red are with the trend and have met all conditions. Orange and purple are against the trend calculations, and Olive circles risky trades against all the filters used to calculate signals.

The reversal signals, are the diamond plots in black, These also represent take profit areas as well.

Another key feature is the Daily / Weekly / Monthly and Yearly open levels displayed as colored dots. A lot of the plays i take use the Daily opens as key levels to take a trade off.

The indicator is designed to give you key information, but be quite customisable as well to suit your exact trading style.
Recommended timeframes i use for this script; Weekly (for key liquidity areas), Trading on the Daily, 6h, 4h, 2h, 1h and 25 minutes.
Backtested Settings and Pairs;
Pair - Timeframe - Signals Inputs - Reversal Inputs - ATR Multiplier - MA Filter
BTCUSD - 1 hr - 3 - 2.8 - 5.5 - NA
ETHUSD - 1 hr - 4 - 2.8 - 5.5 - NA
USDCAD - 1 hr - 4 - 2.8 - 5.5 - NA
GBPUSD - 1 hr - 4 - 2.8 - 5.5 - NA
US30 - 1 hr - 4 - 2.8 - 5.5 - NA
BTCUSD - 4 hr - 2.5 - 2.5 - 3.5 - NA
BTCUSD - 25 mins - 5 - 2.5 - 5.5 - NA
The fundamental part of the script, is the volume weighted bands in blue and red, which help determine the trend and dynamic support and resistance . The blue band is a shorter length than the red band.
When the blue band dips below the red band, this tells us there is a downtrend. And when the blue band is trending above the red band, this is bullish uptrend price action. You will be able to note price whatever the timeframe really respects these bands, and you can use that to your advantage flicking through the high and low timeframes on where price will go next, combined with your own support and resistance levels.
Combined with the candle colors, which change whether they close above or below the main trend colored line (shown below), help identify a change in price action and trend. This allows for low timeframe plays also.
The uptrend and downtrend cicle signals are shown in a few different colors. Green and red are with the trend and have met all conditions. Orange and purple are against the trend calculations, and Olive circles risky trades against all the filters used to calculate signals.
The reversal signals, are the diamond plots in black, These also represent take profit areas as well.
Another key feature is the Daily / Weekly / Monthly and Yearly open levels displayed as colored dots. A lot of the plays i take use the Daily opens as key levels to take a trade off.
The indicator is designed to give you key information, but be quite customisable as well to suit your exact trading style.
Recommended timeframes i use for this script; Weekly (for key liquidity areas), Trading on the Daily, 6h, 4h, 2h, 1h and 25 minutes.
Backtested Settings and Pairs;
Pair - Timeframe - Signals Inputs - Reversal Inputs - ATR Multiplier - MA Filter
BTCUSD - 1 hr - 3 - 2.8 - 5.5 - NA
ETHUSD - 1 hr - 4 - 2.8 - 5.5 - NA
USDCAD - 1 hr - 4 - 2.8 - 5.5 - NA
GBPUSD - 1 hr - 4 - 2.8 - 5.5 - NA
US30 - 1 hr - 4 - 2.8 - 5.5 - NA
BTCUSD - 4 hr - 2.5 - 2.5 - 3.5 - NA
BTCUSD - 25 mins - 5 - 2.5 - 5.5 - NA
릴리즈 노트
overhaul초대 전용 스크립트
이 스크립트는 작성자가 승인한 사용자만 접근할 수 있습니다. 사용하려면 요청 후 승인을 받아야 하며, 일반적으로 결제 후에 허가가 부여됩니다. 자세한 내용은 아래 작성자의 안내를 따르거나 vtrend-script에게 직접 문의하세요.
트레이딩뷰는 스크립트의 작동 방식을 충분히 이해하고 작성자를 완전히 신뢰하지 않는 이상, 해당 스크립트에 비용을 지불하거나 사용하는 것을 권장하지 않습니다. 커뮤니티 스크립트에서 무료 오픈소스 대안을 찾아보실 수도 있습니다.
작성자 지시 사항
please visit vtrendscript.com to access
면책사항
해당 정보와 게시물은 금융, 투자, 트레이딩 또는 기타 유형의 조언이나 권장 사항으로 간주되지 않으며, 트레이딩뷰에서 제공하거나 보증하는 것이 아닙니다. 자세한 내용은 이용 약관을 참조하세요.
초대 전용 스크립트
이 스크립트는 작성자가 승인한 사용자만 접근할 수 있습니다. 사용하려면 요청 후 승인을 받아야 하며, 일반적으로 결제 후에 허가가 부여됩니다. 자세한 내용은 아래 작성자의 안내를 따르거나 vtrend-script에게 직접 문의하세요.
트레이딩뷰는 스크립트의 작동 방식을 충분히 이해하고 작성자를 완전히 신뢰하지 않는 이상, 해당 스크립트에 비용을 지불하거나 사용하는 것을 권장하지 않습니다. 커뮤니티 스크립트에서 무료 오픈소스 대안을 찾아보실 수도 있습니다.
작성자 지시 사항
please visit vtrendscript.com to access
면책사항
해당 정보와 게시물은 금융, 투자, 트레이딩 또는 기타 유형의 조언이나 권장 사항으로 간주되지 않으며, 트레이딩뷰에서 제공하거나 보증하는 것이 아닙니다. 자세한 내용은 이용 약관을 참조하세요.