PROTECTED SOURCE SCRIPT
업데이트됨 Rails [s3]
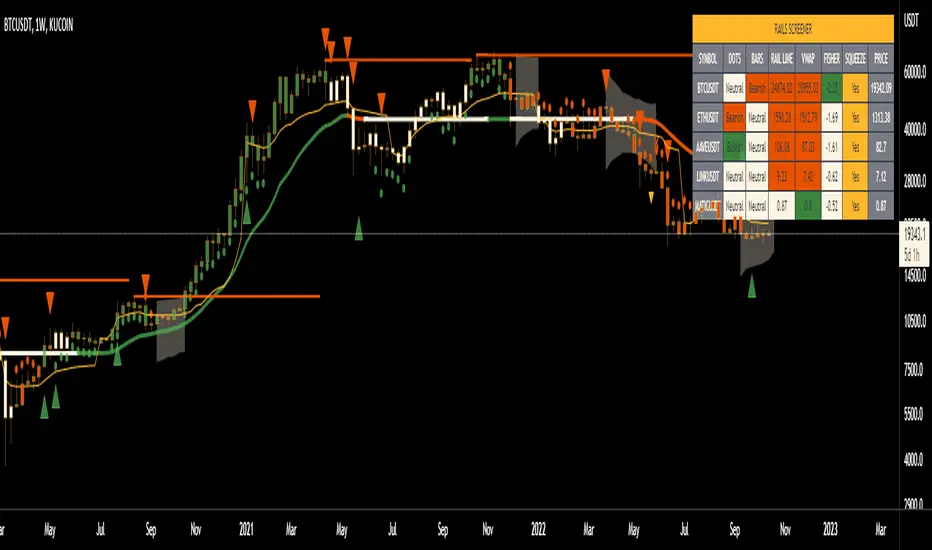
Centered around a Variable Moving Average. The Variable Moving Average (VMA) is a study that uses an Exponential Moving Average being able to automatically adjust its smoothing factor according to the market volatility. In addition to the VMA, the indicator displays breakouts in volume and when the Bollinger Bands are in a squeeze.
Dots = Microtrend
Triangles = Breakouts in Volume
X = Crossover of Moving Averages
Shaded "Cloud" = Bollinger Bands Squeeze
Alerts can be set for Bearish and Bullish strength (Volume Breakouts), Crossovers, and when Squeezes have started and ended.
Dots = Microtrend
Triangles = Breakouts in Volume
X = Crossover of Moving Averages
Shaded "Cloud" = Bollinger Bands Squeeze
Alerts can be set for Bearish and Bullish strength (Volume Breakouts), Crossovers, and when Squeezes have started and ended.
릴리즈 노트
Made UX changes.
릴리즈 노트
Added Murrey Math Lines Channel to indicator.
릴리즈 노트
Fixed shape location and allowed user input to turn on/off Murrey lines
릴리즈 노트
Refined Shape Offset
릴리즈 노트
Added exhaustion levels; set default value for exhaustion levels to on; set default value for Murrey lines to off
릴리즈 노트
Updated chart picture
릴리즈 노트
Fixed spelling error
릴리즈 노트
Tuned squeeze settings
릴리즈 노트
Updated alert messages and code optimized
릴리즈 노트
- Added Screener
- Added diamond symbol to forecast squeeze direction (still confirmed by volume breakout arrow)
릴리즈 노트
-Aesthetic changes
릴리즈 노트
- Added VWAP weighted for volatility- Added ability to see squeezes on higher TF than chart
- Changed normalized volume to show (bigger red/green triangles) whenever above 50 MA
보호된 스크립트입니다
이 스크립트는 비공개 소스로 게시됩니다. 하지만 이를 자유롭게 제한 없이 사용할 수 있습니다 – 자세한 내용은 여기에서 확인하세요.
면책사항
해당 정보와 게시물은 금융, 투자, 트레이딩 또는 기타 유형의 조언이나 권장 사항으로 간주되지 않으며, 트레이딩뷰에서 제공하거나 보증하는 것이 아닙니다. 자세한 내용은 이용 약관을 참조하세요.
보호된 스크립트입니다
이 스크립트는 비공개 소스로 게시됩니다. 하지만 이를 자유롭게 제한 없이 사용할 수 있습니다 – 자세한 내용은 여기에서 확인하세요.
면책사항
해당 정보와 게시물은 금융, 투자, 트레이딩 또는 기타 유형의 조언이나 권장 사항으로 간주되지 않으며, 트레이딩뷰에서 제공하거나 보증하는 것이 아닙니다. 자세한 내용은 이용 약관을 참조하세요.