INVITE-ONLY SCRIPT
업데이트됨 Ghost Vision I

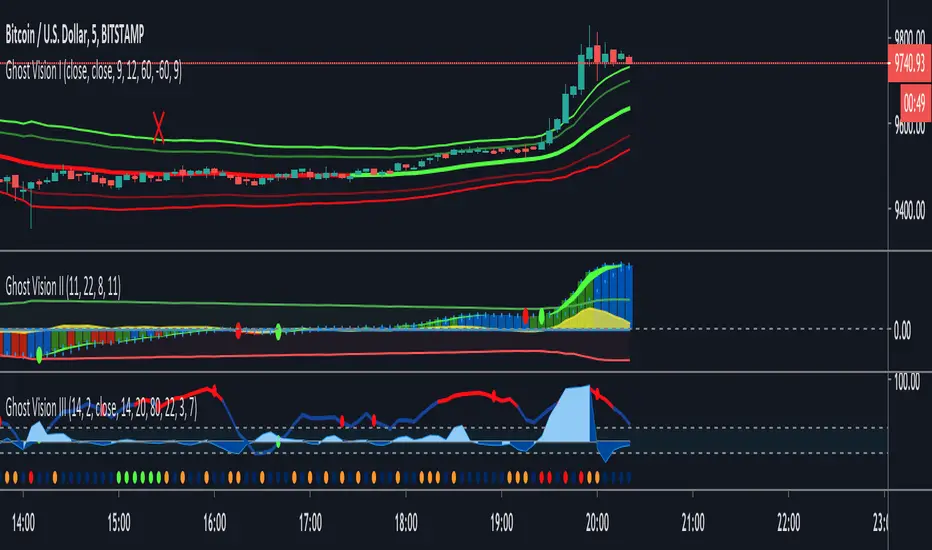
Channels indicate the extreme of the price movement compared to normal movement, a middle line indicates the current trend direction — green for bullish and red for bearish.
Divergences with price are displayed with H — for hidden, and R-for regular likewise green or red for bullish or bearish.
GhostVision I — Will help you to answer the following questions:
Is that price movement has power behind it or it’s just a divergence?
Is the current price is valued fairly or is it extreme?
Is it a good time to enter a position?
Where should I take profit?
Where should put my stop loss?
릴리즈 노트
The new addition of danger zone feature & minor improvements.릴리즈 노트
Fixing a problem caused by the "max_bars_back" error, now all time frames should work as they should.릴리즈 노트
Added my favorite scalping tools on top of GV1 by default so you can have them all at once with one indicator (VWAP, EMA9)- VWAP: Use it for support/resistance and direction of the day
- EMA9: Great for existing a scalp trade before the market turns
- Especially for 5/25min time frame
Blog post on how to use it for day trading coming soon!
(if you're swing trading you can turn it off in the settings)
릴리즈 노트
Added alerts for Danger Zone and Divergences, Don't miss important indications anymore.초대 전용 스크립트
이 스크립트는 작성자가 승인한 사용자만 접근할 수 있습니다. 사용하려면 요청 후 승인을 받아야 하며, 일반적으로 결제 후에 허가가 부여됩니다. 자세한 내용은 아래 작성자의 안내를 따르거나 GhostVision에게 직접 문의하세요.
트레이딩뷰는 스크립트의 작동 방식을 충분히 이해하고 작성자를 완전히 신뢰하지 않는 이상, 해당 스크립트에 비용을 지불하거나 사용하는 것을 권장하지 않습니다. 커뮤니티 스크립트에서 무료 오픈소스 대안을 찾아보실 수도 있습니다.
작성자 지시 사항
면책사항
해당 정보와 게시물은 금융, 투자, 트레이딩 또는 기타 유형의 조언이나 권장 사항으로 간주되지 않으며, 트레이딩뷰에서 제공하거나 보증하는 것이 아닙니다. 자세한 내용은 이용 약관을 참조하세요.
초대 전용 스크립트
이 스크립트는 작성자가 승인한 사용자만 접근할 수 있습니다. 사용하려면 요청 후 승인을 받아야 하며, 일반적으로 결제 후에 허가가 부여됩니다. 자세한 내용은 아래 작성자의 안내를 따르거나 GhostVision에게 직접 문의하세요.
트레이딩뷰는 스크립트의 작동 방식을 충분히 이해하고 작성자를 완전히 신뢰하지 않는 이상, 해당 스크립트에 비용을 지불하거나 사용하는 것을 권장하지 않습니다. 커뮤니티 스크립트에서 무료 오픈소스 대안을 찾아보실 수도 있습니다.
작성자 지시 사항
면책사항
해당 정보와 게시물은 금융, 투자, 트레이딩 또는 기타 유형의 조언이나 권장 사항으로 간주되지 않으며, 트레이딩뷰에서 제공하거나 보증하는 것이 아닙니다. 자세한 내용은 이용 약관을 참조하세요.