OPEN-SOURCE SCRIPT
업데이트됨 Ichimoku Peeks
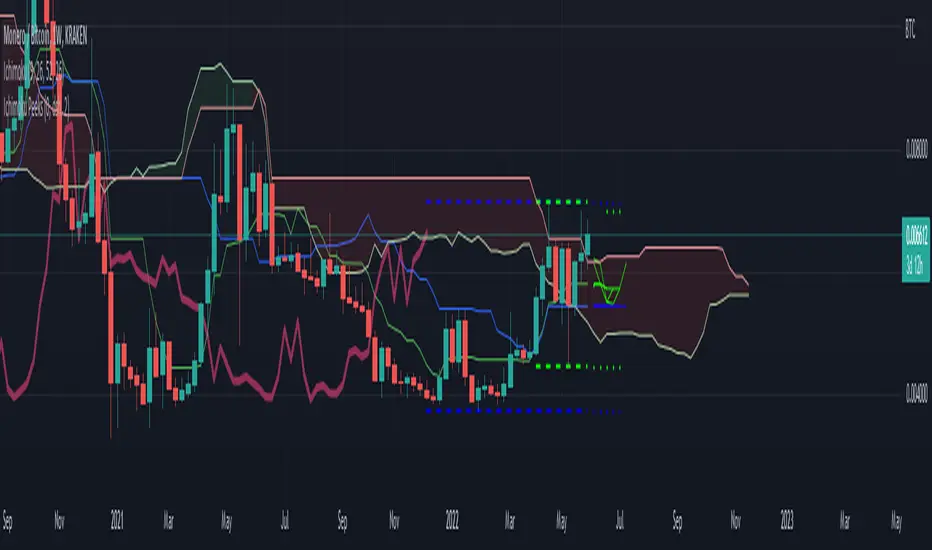
This indicator uses the Ichimoku Tenkan / Kijun trend line formulas to predict what those values will be in the future if current price action does not violate the period highs and lows.
Because of the way Ichimoku formulates the trend, it contains (but does not visualize) this predictive information in a way that moving averages do not.
Sharp chart readers can infer upcoming changes by counting back candles, but the process can be automated, as I've shown here.
This description does not seem to be editable so implementation details and usage will be covered in code commentary.
릴리즈 노트
* Fixed first prediction not rendering in some configs.* Added input boundary lines to show where calculation data is pulled from (off by default).
* Minor config organization.
릴리즈 노트
* Bugfix for visual artifacts. History of first projection was displayed in simple mode as infinite cross tail.* Adjusted "input boundary" diagnostic so that it more coherently relates to the projections. Now first projection drops last candle in channel.
릴리즈 노트
In this update:* More code commentary about usage and theory.
* Input boundaries are now on by default and configurable.
* Input boundaries are extended by default into projected range via `Show Highs/Lows` option.
릴리즈 노트
* Minor comment update to replace preview chart.릴리즈 노트
Documentation and preview update.릴리즈 노트
* Added built in Ichimoku via (lib-hlm)* Removed later projections due to less confidence and to make room for Ichimoku.
* Documentation updates.
* Option to fill in the boundary zones.
오픈 소스 스크립트
트레이딩뷰의 진정한 정신에 따라, 이 스크립트의 작성자는 이를 오픈소스로 공개하여 트레이더들이 기능을 검토하고 검증할 수 있도록 했습니다. 작성자에게 찬사를 보냅니다! 이 코드는 무료로 사용할 수 있지만, 코드를 재게시하는 경우 하우스 룰이 적용된다는 점을 기억하세요.
면책사항
해당 정보와 게시물은 금융, 투자, 트레이딩 또는 기타 유형의 조언이나 권장 사항으로 간주되지 않으며, 트레이딩뷰에서 제공하거나 보증하는 것이 아닙니다. 자세한 내용은 이용 약관을 참조하세요.
오픈 소스 스크립트
트레이딩뷰의 진정한 정신에 따라, 이 스크립트의 작성자는 이를 오픈소스로 공개하여 트레이더들이 기능을 검토하고 검증할 수 있도록 했습니다. 작성자에게 찬사를 보냅니다! 이 코드는 무료로 사용할 수 있지만, 코드를 재게시하는 경우 하우스 룰이 적용된다는 점을 기억하세요.
면책사항
해당 정보와 게시물은 금융, 투자, 트레이딩 또는 기타 유형의 조언이나 권장 사항으로 간주되지 않으며, 트레이딩뷰에서 제공하거나 보증하는 것이 아닙니다. 자세한 내용은 이용 약관을 참조하세요.