INVITE-ONLY SCRIPT
AZ Capital S & R
Overview
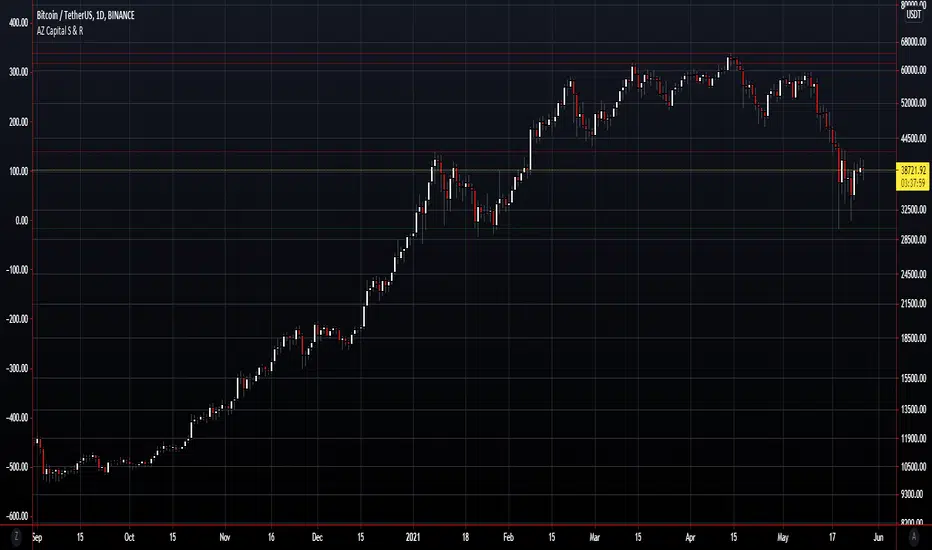
- The algorithm endeavours to robotize the identification of support and resistance levels by recognizing enormous swings/turns in authentic value activity.
- These tops and bottoms in value activity shows where the bunches of buyers or sellers came into the market and may go about as future degrees of support or resistance.
- The code identifies the last 3 huge swing highs and the last 3 swing lows. It at that point places lines on the outline to feature those levels.
- In support and resistance hypothesis, frequently the support becomes resistance and the other way around. Along these lines, the algorithm doesn't just sort swings lows as "support" and swing highs as "resistance". All things considered, the algorithm takes a gander at the swing position comparative with the current close cost.
- In the event that the price is over the level, the algorithm thinks of it as support. On the off chance that the price is beneath the level, the algorithm believes it to be resistance.
- In light of this, the lines are naturally shaded by whether the prices are above or beneath the current close cost. At the point when any of the levels are beneath the nearby value, the lines are shaded green. Then again, at whatever point they are over the nearby, they are shaded red.
초대 전용 스크립트
이 스크립트는 작성자가 승인한 사용자만 접근할 수 있습니다. 사용하려면 요청 후 승인을 받아야 하며, 일반적으로 결제 후에 허가가 부여됩니다. 자세한 내용은 아래 작성자의 안내를 따르거나 Ajiaddo에게 직접 문의하세요.
트레이딩뷰는 스크립트의 작동 방식을 충분히 이해하고 작성자를 완전히 신뢰하지 않는 이상, 해당 스크립트에 비용을 지불하거나 사용하는 것을 권장하지 않습니다. 커뮤니티 스크립트에서 무료 오픈소스 대안을 찾아보실 수도 있습니다.
작성자 지시 사항
Contact me privately for access.
면책사항
해당 정보와 게시물은 금융, 투자, 트레이딩 또는 기타 유형의 조언이나 권장 사항으로 간주되지 않으며, 트레이딩뷰에서 제공하거나 보증하는 것이 아닙니다. 자세한 내용은 이용 약관을 참조하세요.