OPEN-SOURCE SCRIPT
업데이트됨 Chips Average Line (volume price) by RSU
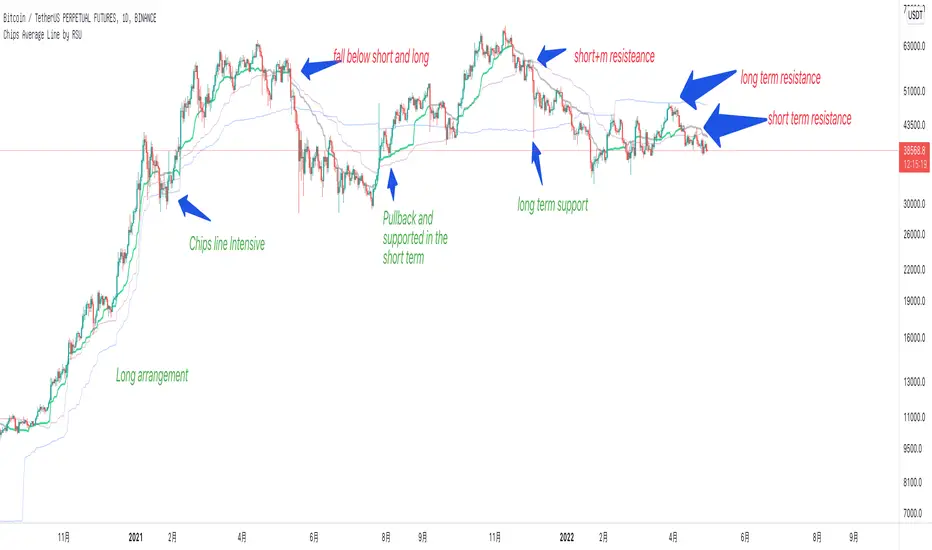
This is a very important volume-price indicator for me.
Displays the average cost of chips for the short term (30 days), medium term (60 days), and long term (200 days).
Chip lines act as support and resistance. The longer the trend days, the greater the strength.
usage:
1. Breakout: If the stock rises, it must be above the short-term chip line. And gradually rise.
2. Sequence: When a bullish trend is formed, the short-term stack is higher than the mid-term stack, and the mid-flag stack is higher than the long-term stack. When there is a bear trend, the order is reversed.
3. Intensive: When the three chip lines are dense, there will be a periodical resonance effect, and the long-term trend will rise or fall sharply
릴리즈 노트
Added smoothing parameter to reduce the jaggedness of the indicator.릴리즈 노트
Changes:All timeframes are supported.오픈 소스 스크립트
트레이딩뷰의 진정한 정신에 따라, 이 스크립트의 작성자는 이를 오픈소스로 공개하여 트레이더들이 기능을 검토하고 검증할 수 있도록 했습니다. 작성자에게 찬사를 보냅니다! 이 코드는 무료로 사용할 수 있지만, 코드를 재게시하는 경우 하우스 룰이 적용된다는 점을 기억하세요.
면책사항
해당 정보와 게시물은 금융, 투자, 트레이딩 또는 기타 유형의 조언이나 권장 사항으로 간주되지 않으며, 트레이딩뷰에서 제공하거나 보증하는 것이 아닙니다. 자세한 내용은 이용 약관을 참조하세요.
오픈 소스 스크립트
트레이딩뷰의 진정한 정신에 따라, 이 스크립트의 작성자는 이를 오픈소스로 공개하여 트레이더들이 기능을 검토하고 검증할 수 있도록 했습니다. 작성자에게 찬사를 보냅니다! 이 코드는 무료로 사용할 수 있지만, 코드를 재게시하는 경우 하우스 룰이 적용된다는 점을 기억하세요.
면책사항
해당 정보와 게시물은 금융, 투자, 트레이딩 또는 기타 유형의 조언이나 권장 사항으로 간주되지 않으며, 트레이딩뷰에서 제공하거나 보증하는 것이 아닙니다. 자세한 내용은 이용 약관을 참조하세요.