The standard setting of RSI is 14 periods, with the 30 line being oversold and the 70 line being overbought.
However, it is not effective to use only that number as an entry.
In the long time frame, it shows the momentum of bullish/bearish pressure and does not reverse immediately.
In the short time frame, the reversal appear frequently and it is difficult to make a decision.
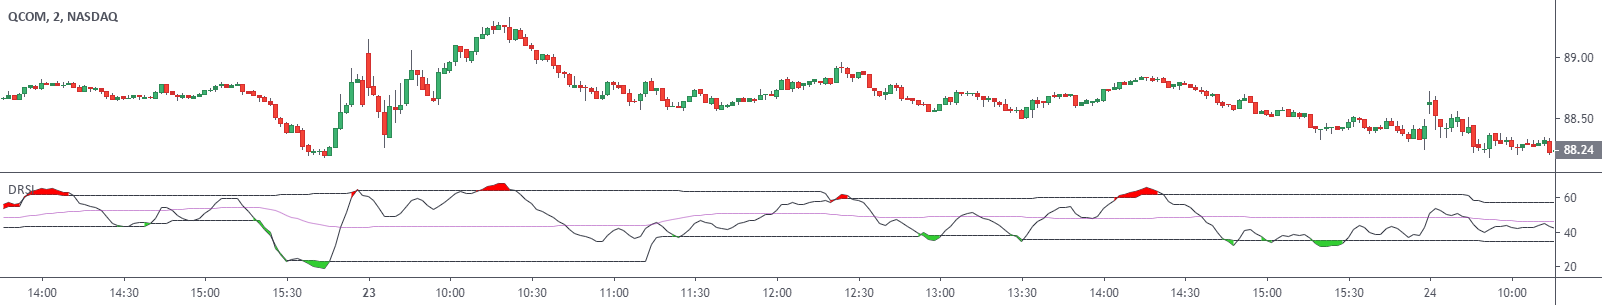
This script calculates the zone based on the recent RSI fluctuation.
You will fix your entry direction whether the center line is above or below the RSI(50).
A return to the zone is a sign of entry, which eliminates hesitation.
It may be able to be used even in parallel range or against trend.
The basic idea is based on the following script;

However, it is not effective to use only that number as an entry.
In the long time frame, it shows the momentum of bullish/bearish pressure and does not reverse immediately.
In the short time frame, the reversal appear frequently and it is difficult to make a decision.
This script calculates the zone based on the recent RSI fluctuation.
You will fix your entry direction whether the center line is above or below the RSI(50).
A return to the zone is a sign of entry, which eliminates hesitation.
It may be able to be used even in parallel range or against trend.
The basic idea is based on the following script;