PROTECTED SOURCE SCRIPT
Trend RSI
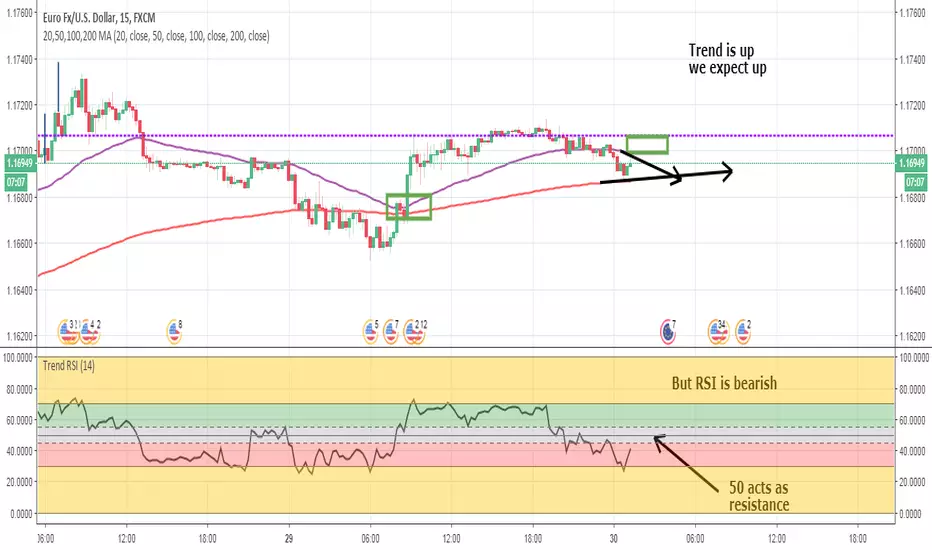
This version of RSI shows the proper levels of how to trade price action.
RSI is more than a reversal tool. It is also a trend following tool.
I've added bands to show Overbought/Oversold.
Above 55 is bullish. Below 45 is bearish.
Do not make any transactions in the 45-55 gray band area.
Coupled with a 50/200 EMA strategy this is more than enough to make a living at trading.
보호된 스크립트입니다
이 스크립트는 비공개 소스로 게시됩니다. 하지만 이를 자유롭게 제한 없이 사용할 수 있습니다 – 자세한 내용은 여기에서 확인하세요.
면책사항
해당 정보와 게시물은 금융, 투자, 트레이딩 또는 기타 유형의 조언이나 권장 사항으로 간주되지 않으며, 트레이딩뷰에서 제공하거나 보증하는 것이 아닙니다. 자세한 내용은 이용 약관을 참조하세요.
면책사항
해당 정보와 게시물은 금융, 투자, 트레이딩 또는 기타 유형의 조언이나 권장 사항으로 간주되지 않으며, 트레이딩뷰에서 제공하거나 보증하는 것이 아닙니다. 자세한 내용은 이용 약관을 참조하세요.